Overview
Are you looking for ways to make data-driven decisions and optimize your data strategies? You’re in the right place! Connecting Power BI and Google Analytics can help you unlock valuable insights into your website’s performance and user behavior.
In this article, we’ll delve into the key features and benefits of both platforms and guide you through the process of integrating them for powerful data analysis and visualization.
Key Takeaways
- The Power BI Google Analytics integration facilitates data analysis and visualization, driving informed decision-making.
- Leverage advanced features and integrations of Power BI and Google Analytics to gain a deeper understanding of performance, identify trends, and drive better business outcomes.
- Utilize third-party solutions like Zuar Runner for enhanced data management between the two platforms.
Related Article:
 Team Zuar

Understanding Power BI and Google Analytics
Power BI, Microsoft’s premier business intelligence tool, allows you to connect data sources and model and visualize data into a report-ready format.
On the other hand, Google Analytics is a web analytics service provided by Google that tracks and reports website traffic, giving you insights into your customers’ online behavior. It is considered the most powerful tool for Web tracking in the world.
Integrating Google Analytics with Power BI allows for visualization and analysis of website data, thus facilitating informed business decision-making.
Both platforms offer unique features that make them indispensable for data analysis and visualization. Power BI provides a comprehensive suite of dynamic visualization tools, while Google Analytics tracks valuable data about your website visitors, such as unique page visits, time spent browsing, and geographic location.
Combining the capabilities of these two platforms enables you to consolidate data from various sources into a single location, making it easier to analyze and interpret your website’s performance.
Power BI Key Features
Power BI can be accessed in either online or local form. Power BI Services is the online version, and Power BI Desktop is the software that needs to be installed on a Windows machine.
Power BI Desktop provides three views for reporting and data modeling, as well as a ‘Query Editor’ that enables users to connect to additional data sets and combine data.
Power BI Service, a cloud-based application, facilitates connecting to Google Analytics and numerous other services, allowing for seamless data integration.
Creating a comprehensive dashboard that combines data from multiple sources and visualizations becomes possible when you connect Google Analytics to Power BI, offering a holistic view of your website’s performance and user behavior.
Google Analytics Key Features
Google Analytics offers a free and paid web analytics service that provides statistical insights related to website usage.
To make the most of this tool, it’s important to select Google Analytics tracking options that align with your marketing goals.
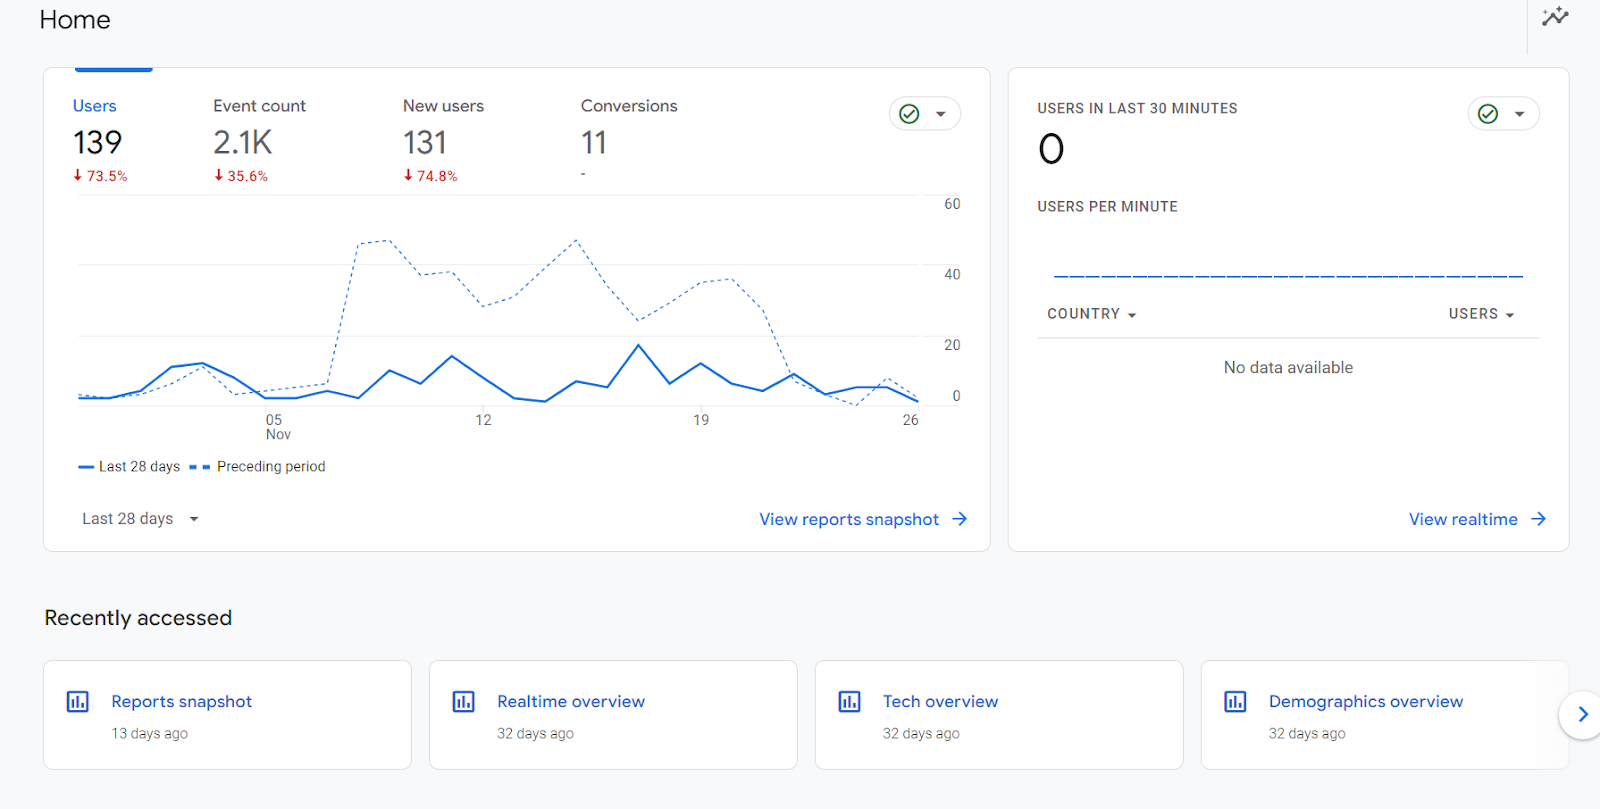
By tracking user data, such as the number of unique page visits, amount of time spent browsing, and geographic location, you can assess whether your marketing goals are being met and identify potential improvements for your website.
Google Analytics also provides interactive features such as dashboards, motion charts, and scorecards to visualize data and KPIs in real time.
With the latest iteration of Google Analytics, GA4, an event-based model is utilized instead of the previous session-based model, offering numerous benefits such as cross-platform analysis, improved pathing analysis capabilities, and an enhanced capacity to predict user behavior.
However, some reporting features in GA4 have been limited to the paid version. Making it difficult for some professionals to build effective visualizations.

Connecting Power BI to Google Analytics
Two options are available for connecting Google Analytics to Power BI: either directly within the Power BI app or by utilizing a third-party platform like Zuar Runner.
We'll start by looking at how to integrate the two platforms through Power BI Desktop.
Power BI Desktop Integration
The Power BI Desktop application enables you to connect Google Analytics data to your Power BI account by following these steps:
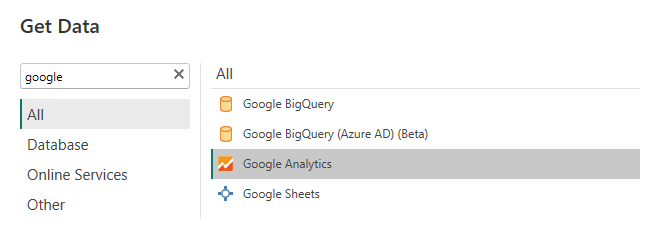
1. Select the ‘Get Data’ option in the home ribbon in Power BI Desktop.
2. From the 'Online Services' category on the left, choose the Google Analytics connector.
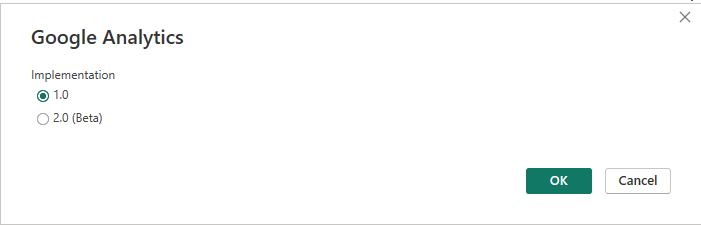
3. Select the type of implementation. At the time of writing this article, Power BI is testing the 2.0 version.
4. Sign in to your Google Analytics account and grant Power BI access.
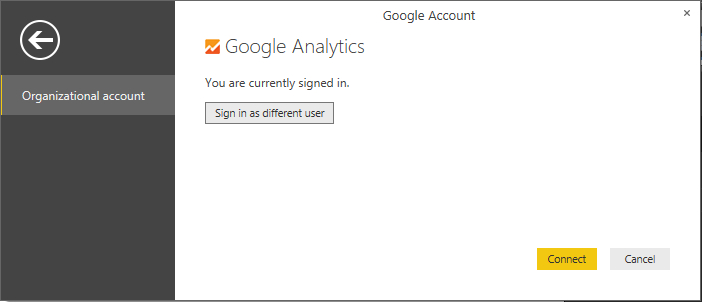
5. A new dialogue box will open, allowing you to select the data to load into Power BI.

Visualizing Google Analytics Data in Power BI
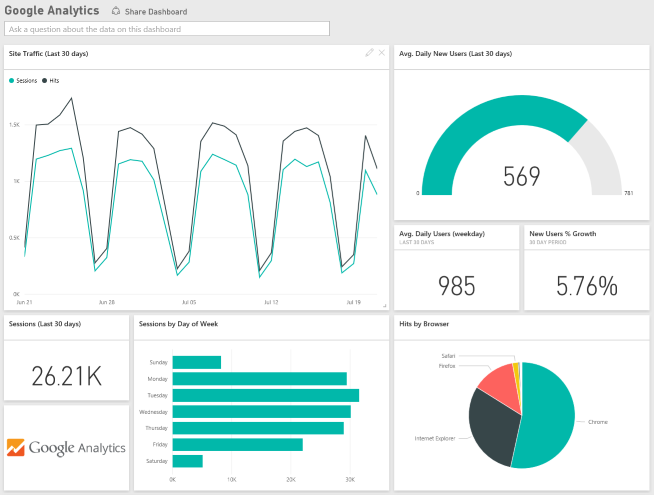
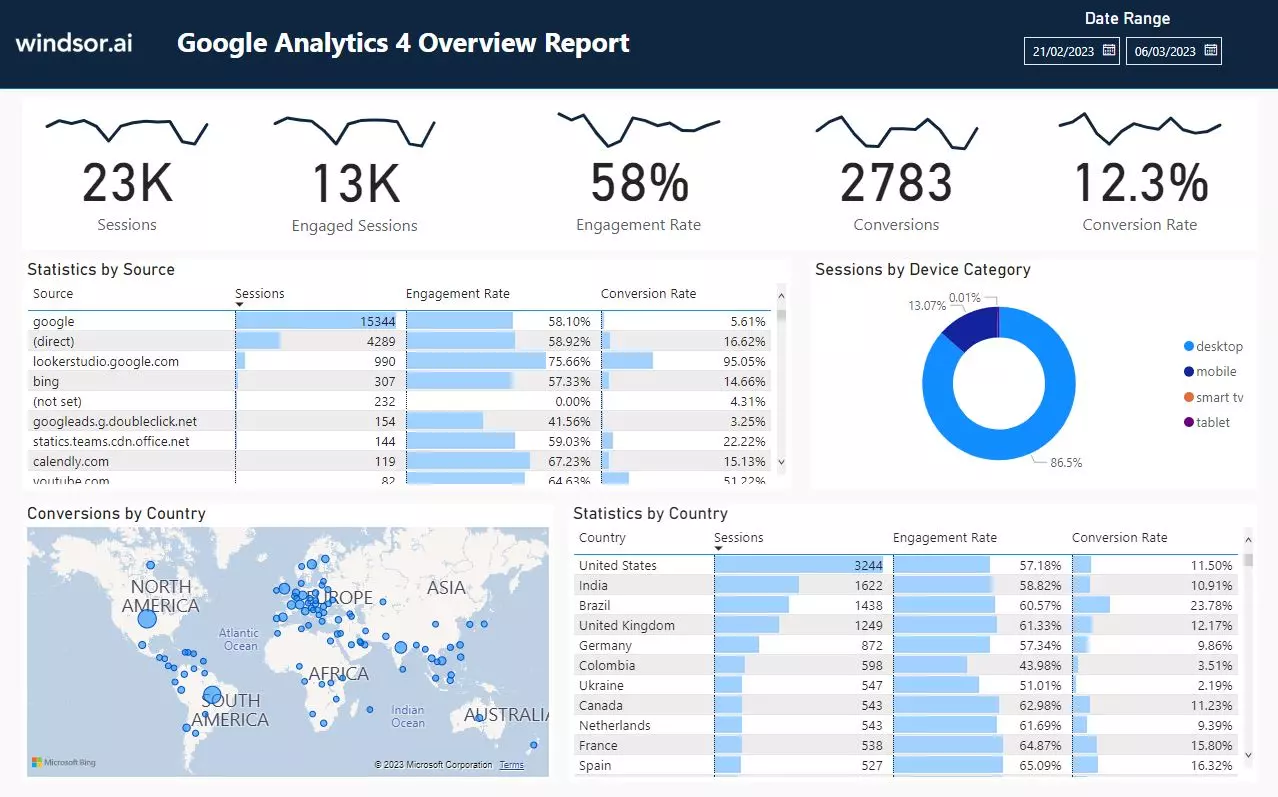
After connecting Google Analytics to Power BI, you can exploit the data visualization capabilities of Power BI to produce custom reports and interactive visualizations that highlight your website’s performance and user behavior.
These visualizations allow for quick identification of trends, patterns, and areas for improvement, ultimately guiding data-driven decisions that optimize your marketing strategies and enhance your website’s user experience.
In Power BI, you can create a variety of visualizations, including:
- Bar charts
- Pie charts
- Maps
- Line charts
- Scatter plots
- Area charts
- Funnel charts
- Gauge charts
By combining these visualizations into a single workspace, you can create interactive dashboards that provide a comprehensive view of your website’s performance and user behavior. This enables you to effectively analyze and explore your data.
Building Custom Reports
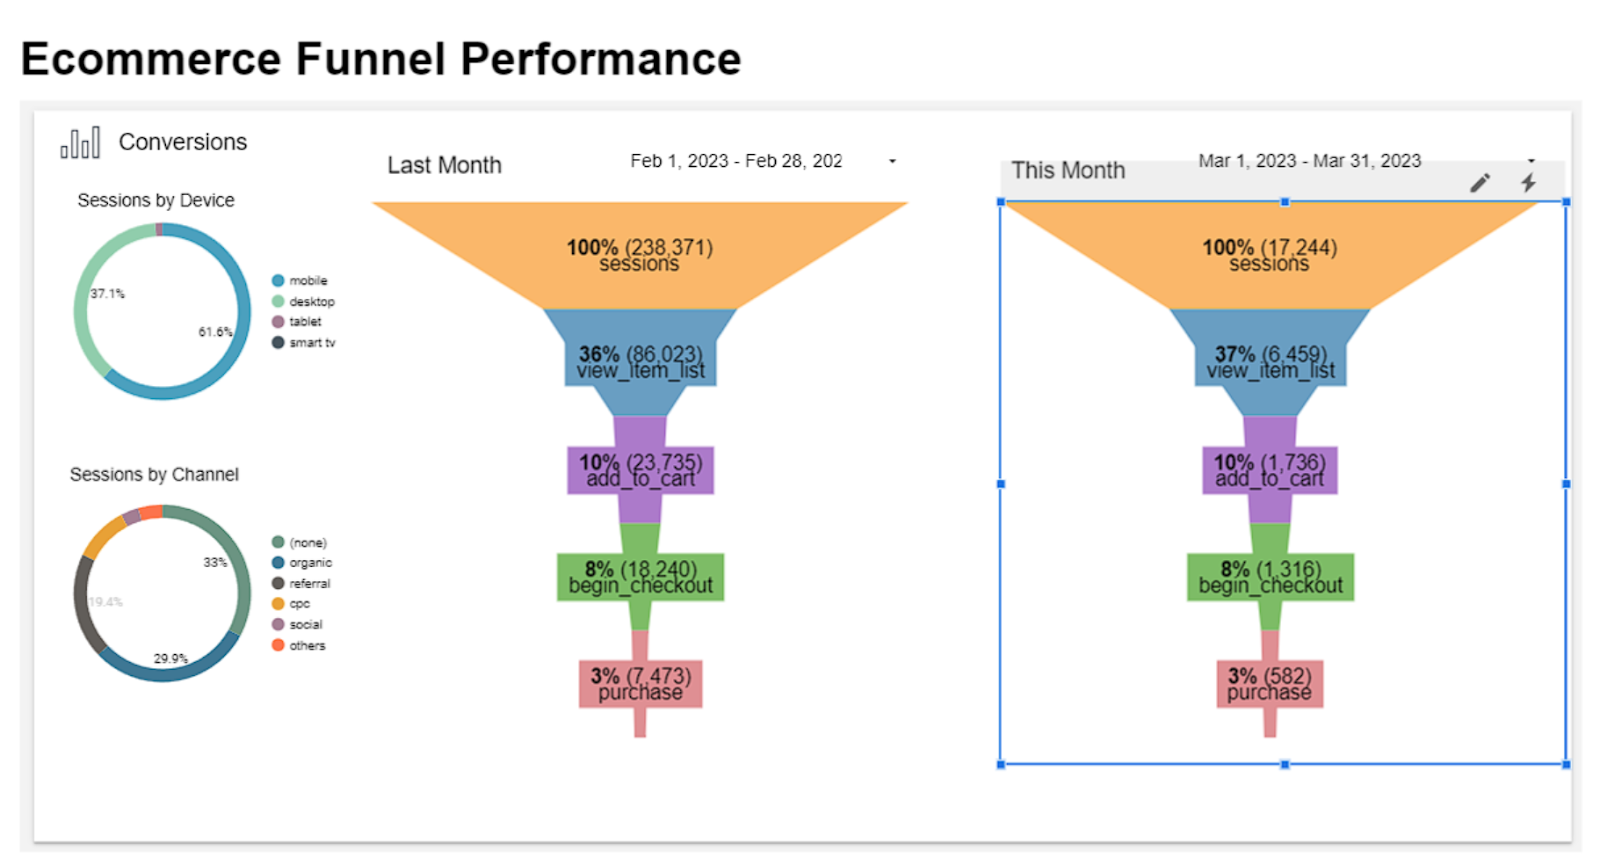
Building custom reports in Power BI using your Google Analytics data allows you to tailor your insights and analysis to your specific business needs. Additionally, you can create funnel visualization to analyze your customer behavior within your website.
By selecting the appropriate data source and configuring it according to your requirements, you can create reports that provide a detailed view of your website’s performance and user behavior.
Power BI offers a range of features that can help you customize the appearance of your report, such as themes and formatting options. Additionally, you can incorporate interactive features, such as filters and slicers, to enable users to investigate the data more thoroughly.
Building custom reports that focus on the data most relevant to your business allows for effective analysis and interpretation of your website’s performance, leading to informed decision-making and optimized strategies.
Designing Interactive Visualizations
Designing interactive visualizations in Power BI is an effective way to enhance user experience and data exploration.
Interactive visualizations enable users to interact with the data and explore it more thoroughly, uncovering insights that may not be immediately obvious.
To design interactive visualizations in Power BI, follow these steps:
- Start by selecting a visualization to make it active.
- Customize and tailor the visualization to suit your requirements.
- Combine multiple visualizations into a single workspace to create interactive dashboards.
- Allow users to delve into the data more extensively, revealing valuable insights.
Related Article:
Team Zuar

Overcoming Limitations and Challenges
While connecting Power BI to Google Analytics can provide valuable insights, there are some limitations and challenges that you might encounter, such as API quota limits and high-traffic web pages.
Google Analytics API Quota Limits
The Google Analytics API quota limits indicate the maximum number of Google Analytics requests that can be made to the API within a specified timeframe.
To manage these quota limits effectively, you can implement strategies such as batching requests, caching data, and utilizing the API’s pagination features.
Effectively managing data requests helps avoid reaching the quota limits and ensures access to the data required for informed decision-making.
If you find that your current quota limits are too restrictive, you can request an increase to your quota by contacting Google Analytics support.
By adjusting your quota limits and employing efficient data management strategies, you can maximize the value of your Google Analytics data and make the most of your Power BI integration.
Handling High-Traffic Web Pages
Managing high-traffic web pages effectively is essential to ensure accurate data representation, as the data collected can be distorted by the high number of visitors.
To guarantee precise data representation in Power BI, you can employ data sampling, data filtering, and data aggregation techniques.
By utilizing these recommended practices, you can minimize the impact of high traffic on your data and ensure that your Power BI visualizations accurately represent your website’s performance and user behavior.
This, in turn, will enable you to make more informed decisions and optimize your marketing strategies based on reliable data.
Finally, it is important to have the paid version of Google Analytics (GA360) due to the extended capacities of creating events, audiences, dimensions, etc.

Leveraging Advanced Features and Integrations
Power BI and Google Analytics offer advanced features and integrations that can greatly enhance your data analysis and decision-making capabilities. Some of the benefits of using these tools include:
- Combining data from multiple sources to get a comprehensive view of your business—for instance, Google Ads Manager, Facebook Ads, YouTube Ads, etc.
- Leveraging AI and machine learning tools for predictive analytics and enhanced data exploration
- Unlocking new insights and making more informed decisions
By utilizing these tools, you can take your data analysis to the next level and drive better business outcomes.
Using these advanced features and integrations, you can:
- Gain a deeper understanding of your website’s performance and user behavior
- Identify trends and patterns that can inform your marketing strategies and website improvements
- Drive your business forward and stay ahead of the competition
Combining Data from Multiple Sources
Combining data from multiple sources in Power BI can provide a comprehensive view of your website’s performance and user behavior, enabling you to analyze and interpret your data more effectively.
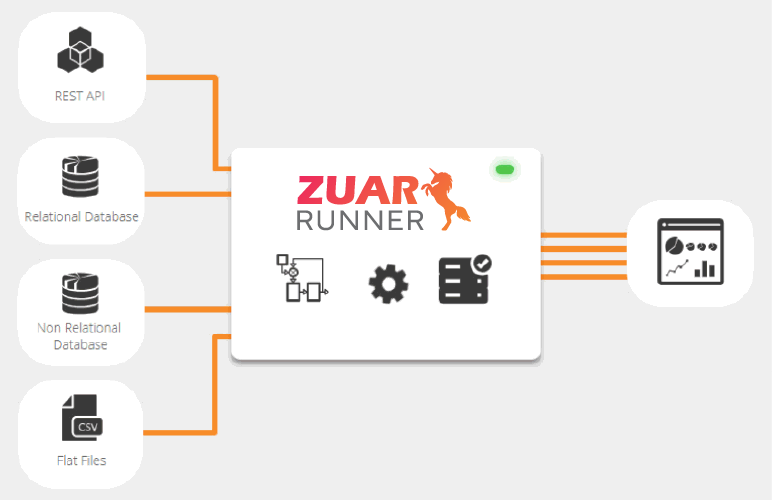
Data from multiple sources can be integrated using third-party solutions, such as ETL/ELT platforms, such as Zuar Runner.
By implementing an automated data pipeline, you can consolidate data from various sources into a single point of reference, giving you a holistic view of your website’s performance and user behavior, ultimately enabling you to make more informed decisions and optimize your marketing strategies.
This approach can lead to significant improvements in your website’s performance and user experience, driving increased traffic, conversions, and revenue.
Learn more about Zuar Runner...

Utilizing AI and Machine Learning Tools
Leveraging AI and machine learning tools in Power BI can greatly enhance your data analysis capabilities and enable you to make more precise predictions and decisions.
By using algorithms to analyze data and generate predictions, these tools can help you recognize patterns and trends in your data, as well as uncover valuable insights that may not be immediately obvious.
By incorporating AI and machine learning tools into your Power BI analysis, you can:
- Gain a deeper understanding of your website’s performance and user behavior
- Identify trends and patterns that can inform your marketing strategies and website improvements
- Ultimately gain increased traffic, conversions, and revenue, helping you stay ahead of the competition

Third-Party Solutions for Enhanced Data Management
In addition to the native integration between Google Analytics and Power BI, there are several third-party solutions available that can enhance data management and simplify the connection process.
ETL/ELT platforms (such as Zuar Runner) offer better control, data transformation, and seamless integration between Google Analytics and Power BI, ensuring that you get the most accurate and valuable insights from your data.
ETL/ELT Platforms
ETL/ELT platforms are software tools used to facilitate the control, transformation, and integration of data between various sources.
ETL (extract, transform, load) platforms extract data from one source, transform it into a format compatible with another source, and then load it into the destination source.
ELT (extract, load, transform) platforms do the same thing, but the data transformation phase occurs after the data is loaded to the target destination.
Utilizing an ETL/ELT platform offers several benefits for your business, including:
- Accurate data representation in Power BI
- Increased control and automation of the data management process
- Informed decision-making and optimization of marketing strategies based on reliable data

Enhancing Your Power BI Google Analytics Integration
As we've illustrated, connecting Google Analytics and Power BI can significantly enhance your data analysis capabilities and enable you to make data-driven decisions that optimize your marketing strategies and website performance.
With the latest version of Google Analytics (GA4), integration with a tool like Power BI is often necessary.
We've also shown that there are several methods of implementing this integration, but how do you know which method is best for your unique business?
By consulting with our data team at Zuar, we can give you detailed recommendations for how to best integrate these two platforms, along with how to optimize the rest of your data stack.
By meeting with our team, you can also learn more about how our solutions can enhance this integration.
Our data pipeline solution, Zuar Runner, can automate the collection, modeling, staging, warehousing, and monitoring of all your data.
Zuar Portal can connect to Power BI (as well as other BI platforms like Tableau) to create a centralized hub for all your reporting. This convenient data portal can then be securely shared with employees, customers, vendors, or any other stakeholder.
Get the ball rolling by scheduling a data strategy assessment with one of our data experts!
Team Zuar Team Zuar