
Overview
Imagine owning a gold mine of data but struggling to make sense of it all. That’s where many businesses find themselves when it comes to Google Analytics.
Exporting Google Analytics data is a powerful way to unlock valuable insights, optimize marketing strategies, and make informed decisions.
But how do you go about doing that? Fear not, as we’ve crafted the ultimate beginner’s guide to exporting your Google Analytics data, from manual exports to using API integrations.
In this guide, we’ll dive deep into the importance of exporting Google Analytics data, discuss the top methods to do so, explore integrating data with other tools, and provide tips for effective data analysis and visualization.
By the end of this journey, you'll know how to export data from Google Analytics and will be well-equipped to extract meaningful insights and drive revenue from your data.
Key Takeaways
- Exporting Google Analytics data and reports is essential for businesses to make informed decisions, monitor long-term trends, and integrate data with other tools.
- Leveraging the Google Analytics API offers advanced reporting capabilities as well as custom reports, data integration, and greater control over export.
- Following best practices, such as setting clear objectives when analyzing GA Data, will ensure comprehensive insights to drive business growth.

Understanding the Importance of Exporting Google Analytics Data
When it comes to business intelligence, data is king. Businesses benefit significantly from exporting Google Analytics data and reports, as it aids them in making well-informed decisions, monitoring long-term trends, and integrating data with other tools for a broader understanding.
Whether exporting raw data for in-depth analysis or simply fetching specific reports, having the right approach and tools can make all the difference.
Benefits of Exporting Raw Data
Raw data in Google Analytics is a treasure trove of insights, containing information such as IP addresses, session duration, page views, and more, gathered from website visitors.
Exporting raw data allows for unlimited user segmentation, custom dimensions, and metrics, and helps avoid sampling issues. This means you’ll have the power to dive deep into the nuances of your data, uncovering valuable insights that can drive your business forward.
Creating custom reports tailored to your unique needs becomes possible when you export raw data, allowing for the incorporation of custom dimensions.
Common Challenges in Exporting Data
Exporting data isn’t always a walk in the park. To begin with, the technical expertise required varies depending on the method employed. Here are the different methods and the level of technical expertise required for each:
- Manual export from the GA dashboard: Basic understanding of the platform.
- Using the Google Sheets add-on: Intermediate technical abilities.
- Leveraging the Google Analytics API: Advanced technical abilities.
Moreover, API limitations can pose constraints when exporting data from Google Analytics, such as the number of requests, the amount of data that can be retrieved, and the time required to process the requests.
Considering these challenges, it’s time to delve into the top methods for exporting data from Google Analytics.

Top Methods to Export Google Analytics Data
There are several methods to export Google Analytics data, each suited for different needs and expertise levels.
While manual export from the GA dashboard is the most common method, using the Google Sheets add-on or leveraging the Google Analytics API can offer advanced reporting and automation capabilities.
In the following sections, we’ll examine each method in detail, discussing its features, advantages, and limitations.
Manual Export from GA Dashboard
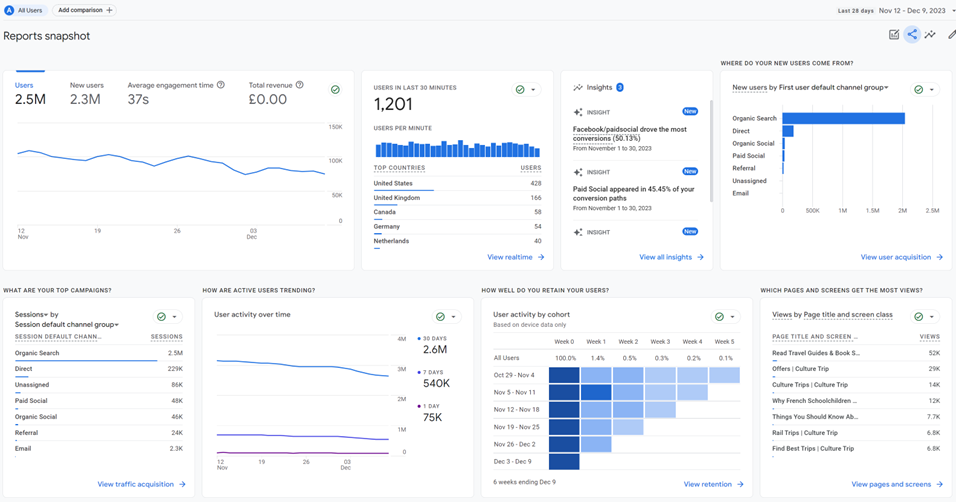
Manual export from the GA dashboard is a straightforward method for smaller data sets. It’s as simple as clicking the ‘Export’ button, and voilà, your data is ready to be downloaded in XLSX, CSV, or PDF file formats.
This method is ideal for those who require a quick snapshot of their data and prefer a hassle-free approach.
However, this method has its limitations. Manual export is restricted to a single chart or time period, and for each month or chart, multiple exports are required. Exports are limited to 5,000 rows.
Additionally, it can be time-consuming and limited in scope, making it less suitable for large-scale data analysis. For more advanced reporting and automation, let’s explore the Google Sheets add-on method.
Using Google Sheets Add-on
Google Sheets add-on is a powerful tool that enables you to:
- Export Google Analytics data directly to your spreadsheet
- Schedule data exports
- Customize report configurations
- Have greater flexibility and control over your data
While the Google Sheets add-on method is convenient and versatile, it requires a basic understanding of dimensions and metrics to fully utilize its capabilities.
If you’re looking for even more advanced reporting and automation options, leveraging the Google Analytics API might be the way to go.
Some add-ons offer a free version for limited time/queries. After that, you’ll need to pay to make the data available.
Leveraging Google Analytics API
Leveraging the Google Analytics API offers several benefits:
- Advanced reporting and automation capabilities, including Google Analytics reports
- Creation of custom reports and visually appealing dashboards with the help of reporting API
- Data integration with other platforms, facilitated by Google Analytics APIs
This method is a perfect fit for those with programming skills and a hunger for in-depth data analysis.
However, the Google Analytics API method does come with its own set of challenges. It requires knowledge of JavaScript and PHP, and there are daily API request limits to consider.
Nonetheless, the API method offers a robust solution for those seeking greater control and customization over their data export process, especially when working with datasets Google Analytics API provides. To fully utilize this method, one must enable Google Analytics API.
Utilizing Third-Party Integration Options
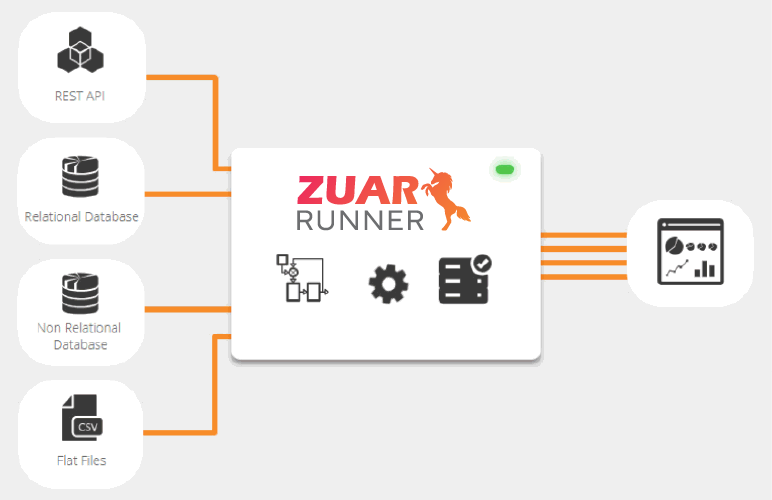
Leveraging ETL/ELT platforms like Zuar Runner allows you to automate Google Analytics Reports by creating an automated data pipeline. This is a more robust, plug-and-play solution that does not require programming expertise.
This powerful platform allows you to collect and prepare Google Analytics data, along with data from hundreds of other potential sources, on an automated schedule, fully prepped for analytics.
With a pre-built connector for Google Analytics, you can get data flowing in a matter of minutes.
Learn more about Zuar Runner + Google Analytics...


Integrating Google Analytics Data with Other Tools
Integrating Google Analytics data with other tools, such as CRM, marketing platforms, and analytics tools, allows you to gain a comprehensive understanding of user behavior and optimize marketing strategies.
By combining data from multiple sources, you can create a holistic view of your business, empowering you to make data-driven decisions that drive growth.
For instance, you can connect your property with Looker Studio and explore your data easily without any constraints.
With a solid understanding of data integration, you’ll be on track to fully unlock the potential of your Google Analytics data.
Combining Data for Comprehensive Insights
Combining data from multiple sources can provide numerous advantages, such as:
- Obtaining a comprehensive overview of your business
- Gaining a more precise understanding of what is happening within your organization
- Consolidating multiple data sources into a single dataset for easier analysis
Essentially, merging data sources enables the discovery of new insights that might not be achievable with individual data sources.
However, the process of combining data from multiple sources can be challenging. Ensuring the accuracy and timeliness of the data, as well as proper formatting and structuring for analysis, can be daunting tasks—which is why recommend implementing a data integration solution like Zuar Runner.
Despite these challenges, the benefits of combining data to gain comprehensive insights are well worth the effort.

Tips for Effective Data Analysis and Visualization
Now that you’re equipped with the knowledge to export your Google Analytics data, it’s time to make the most of it.
Effective data analysis and visualization are critical for extracting valuable insights and driving business growth. In the following sections, we’ll provide tips for selecting the right data visualization tools and offer best practices for data analysis.
Mastering data analysis and visualization will enable you to transform your Google Analytics data into actionable insights, fueling your business’s forward momentum.
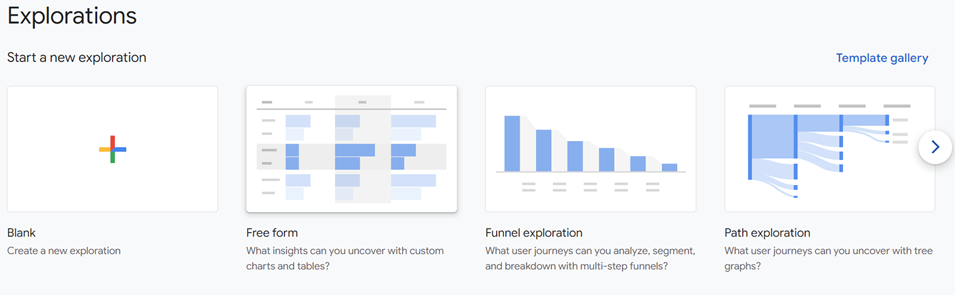
Selecting the Right Data Visualization Tools
Choosing the appropriate data visualization tools is crucial for effectively presenting and analyzing your data. Widely used tools like Google Data Studio and Tableau offer various visualization options, such as:
- Bar charts
- Line graphs
- Scatter plots
- Pie charts
- Heat maps
- Tree maps
- Bubble charts
- Geographic maps
- Funnel charts
- Path graphs
Each tool has its unique features and capabilities, making it essential to evaluate which one best fits your needs and data types.
Familiarizing yourself with the selected tool through tutorials, videos, and hands-on practice will enable you to maximize its potential and enhance your data analysis capabilities.
Choosing the right data visualization tools will equip you well to convert complex data into significant insights.
Best Practices for Data Analysis
Effective data analysis requires a combination of the right tools and a deep understanding of the data.
Some recommended practices include setting clear objectives, segmenting data, and utilizing appropriate visualization techniques.
Data segmentation can be achieved by categorizing user types, devices, locations, or other criteria, allowing for more granular analysis. Implementing these best practices and utilizing the right visualization techniques will guarantee a comprehensive and effective data analysis.

Google Analytics Export Next Steps
In conclusion, exporting Google Analytics data is a powerful process that enables businesses to unlock valuable insights, optimize marketing strategies, and make informed decisions.
If you want to take your Google Analytics to the next level, Zuar is here to help. Through our solutions, you can automate the flow of data from Google Analytics and combine it with data from hundreds of other potential data sources by using Zuar Runner.
Collect, transform, model, warehouse, report, monitor, and distribute: it's all managed by this robust data pipeline solution.
Additionally, you can create a one-stop shop for all your BI reporting by implementing Zuar Portal. This data portal solution is an easy way to create unique analytics hubs for executives, employees, partners, vendors, customers, and more.
Learn more about our solutions, as well as our data services, by scheduling some time with one of our friendly data experts:
 Team Zuar
 Team Zuar

Frequently Asked Questions
How do I download my entire Google Analytics data?
To download your entire Google Analytics data, navigate to the dashboard and open a report. Click Export, select your desired file format, such as CSV or PDF, and click Download.
Make sure to add any desired dimensions and metrics and to select the desired date range prior to downloading.
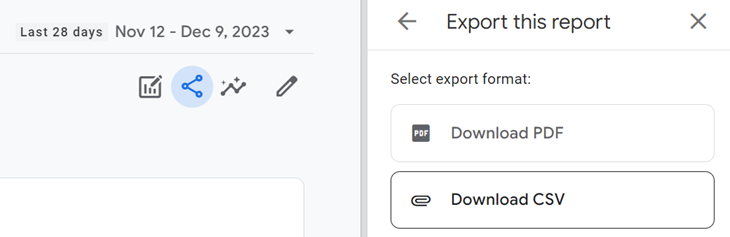
How do I export data from Google Analytics to CSV?
Export data from Google Analytics to CSV by selecting the report you'd like to export, setting a date range, clicking the Share this report button, and then selecting Download File > Download CSV.
What are the key benefits of exporting raw data from Google Analytics?
Exporting raw data from Google Analytics offers numerous benefits, such as the ability to customize metrics and segmentation, as well as avoiding sampling issues.
What are the primary differences between Universal Analytics and Google Analytics 4?
The primary differences between Universal Analytics and Google Analytics 4 include data processing, reporting capabilities, and data export options.
