
Overview
Imagine transforming raw data into actionable insights that drive business decisions with ease and efficiency. Power BI, a versatile business intelligence platform by Microsoft, offers an end-to-end solution for data integration, transformation, visualization, and collaboration.
We will dive into the Power BI architecture details, helping you understand its significance, key elements, data handling functionalities, and additional components that improve its capabilities.
In this article, we will explore the robust Power BI architecture, its features, and capabilities that make it an outstanding business intelligence solution for organizations of all sizes.
Related Article:
 Matt Palmer

Understanding Power BI Architecture
Power BI is an all-in-one business intelligence platform that streamlines the process of analyzing and visualizing data from various sources, including databases, flat files, and cloud services.
Its architecture is the backbone of this comprehensive system, ensuring optimal performance and user experience with the help of Power BI tools.
You might be wondering what exactly Power BI architecture is and why it holds such significance. Let’s explore the realm of Power BI to discover these answers.
Importance of Power BI Architecture
The significance of Power BI architecture lies in its ability to:
- Manage complex data integration, transformation, visualization, and collaboration processes efficiently
- Ensure data accuracy and consistency across various sources.
- Ensure that users can quickly and easily access, analyze, and share data
- Guarantee optimal performance and user experience
Moreover, Power BI architecture is designed to handle various data formats, such as:
- Excel
- XML
- JSON
- CSV
This makes it a versatile solution for businesses with diverse data sources. It also offers advanced security features to protect sensitive information, keeping your business data safe and compliant.
Key Components of Power BI Architecture
The Power BI architecture consists of several key components that work together to provide a seamless experience for users. These include:
- Data sources: Places where the data is coming from
- Power Query Editor: Tool used for data transformation
- Power BI Desktop: Used for modeling and reporting
- Power BI Service: Cloud-based platform for sharing and publishing reports
- Power BI Gateway: Bridge between Power BI Services and On-premises
Data sources can range from databases and files to cloud services, offering users a wide variety of options to connect and transform their data.
The Power Query Editor is a powerful tool that helps users clean, shape, and transform data before loading it into Power BI.
Power BI Desktop serves as the primary workspace for building data models and visualizations, allowing users to connect and load data, create relationships between tables, and define measures and calculated columns.

Data Integration and Transformation in Power BI
Power BI simplifies the process of integrating and transforming data from multiple sources, making it ready for analysis and visualization. By offering a range of data sources and connectivity options, users can easily connect and transform their data to suit their specific needs.
We will now explore the diverse data sources and connectivity options in Power BI and also shed light on the Power Query Editor, an effective instrument for data transformation.
Data Sources and Connectivity
Power BI supports a variety of data sources, including online services, databases, and files, allowing users to connect to and integrate data from multiple sources with ease. It offers various data connection options, such as DirectQuery, Live Connection, and Import, to cater to different user requirements.
With a maximum capacity for importing data from on-premise or online services of 1 GB, Power BI employs powerful compression algorithms to import and store the data within the PBIX file, ensuring efficient data storage and retrieval. This connectivity ensures that you can gather data from wherever it resides.
Power Query Editor
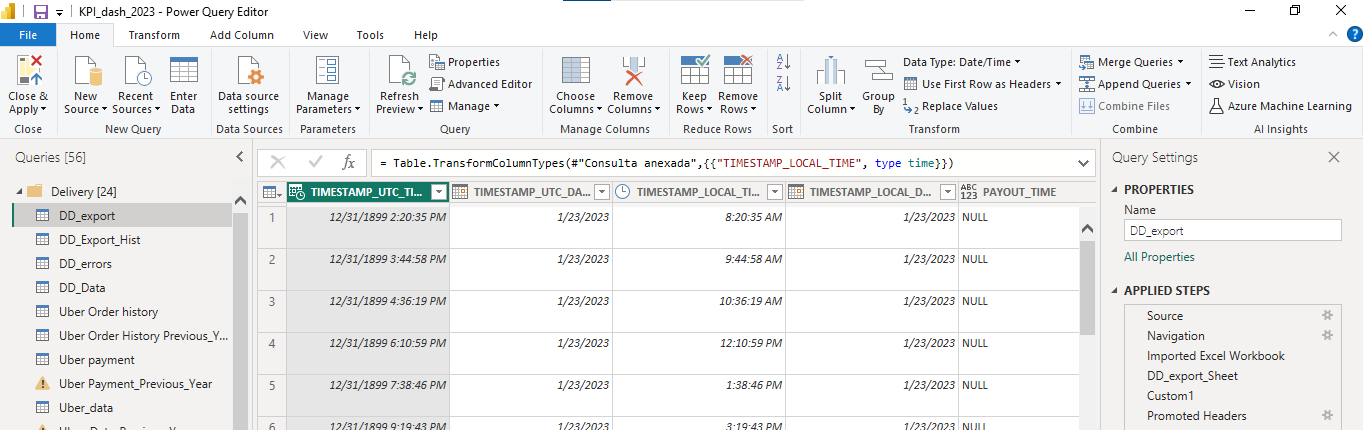
The Power Query Editor is a crucial component of Power BI that enables users to edit and transform data files before loading them into the Power BI dashboard. It offers a wide range of operations, such as:
- Selecting columns and rows
- Pivoting and unpivoting columns
- Splitting columns and rows
- Removing duplicates
- Filtering and sorting data
- Merging and appending tables
- Adding custom columns
- Applying transformations and calculations
These operations allow users to clean and shape their data as required.
Data transformation in Power BI is essential because data obtained from different sources often comes in unstructured formats and requires formatting to extract actionable insights.
By using the Power Query Editor, users can preprocess or clean the data and apply business rules to transform the data before loading it into the data warehouse, ensuring a consistent and accurate data model for analysis and visualization.
Limitations of Power Query Editor
While this is a powerful tool in Power BI, but it does have limitations including scalability, performance with large datasets, and amount of data source options.
If you are looking for a more robust data transformation and integration solution, consider implementing an ELT platform such as Zuar Runner. This end-to-end data pipeline solution extracts, loads, and transforms data from a large range of diverse data sources and can scale with the size of your business and the size of your datasets.
Learn more about how Zuar Runner can modernize your data integration and transformation.

Power BI Desktop: Your Data Modeling Workspace
Power BI Desktop is the primary workspace for building data models and visualizations, offering users a comprehensive environment for connecting to data sources, transforming data, and creating reports and dashboards.
We will now delve into the features and capabilities of Power BI Desktop, focusing on its role as a central hub for data modeling and visualization.

Connecting and Loading Data
Connecting and loading data into Power BI Desktop is a simple process that involves selecting a data source, entering the relevant connection details, and loading the data into the workspace.
Users can choose from a variety of data sources, such as databases, flat files, and cloud services, and connect to them directly or through a live connection, depending on their needs.
Once the data is connected and loaded, users can proceed to build their data models and visualizations, transforming the raw data into actionable insights.
Building Data Models
Building data models in Power BI Desktop involves creating relationships between tables, defining measures and calculated columns, and organizing data into a structured format for analysis.
Users can leverage the powerful Data Analysis Expressions (DAX) library to construct expressions and formulas for newly created measures and visualizations, providing greater flexibility and control over their data models.

Once the data model is built, users can test and validate it for accuracy and consistency, ensuring that the data is correctly represented and ready for analysis.

Visualizing Data with Power BI Reports and Dashboards
Power BI offers a wide range of visualization options, enabling users to create interactive reports and dashboards that provide a comprehensive view of their data.
Next, we will explore the process of designing reports and dashboards in Power BI, which empowers users to fully leverage their data by using effective visualization and analysis techniques.
Creating Reports
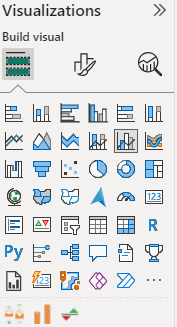
Creating reports in Power BI involves selecting visualizations, adding data fields, and customizing the appearance and interactivity of the visuals.
Users can choose from a variety of visualization types, such as bar charts, pie charts, line charts, and maps, to best represent their data and tell a compelling story.
Users can choose from a variety of visualization types, such as bar charts, pie charts, line charts, and maps, to best represent their data and tell a compelling story.
By combining different visuals and data fields, users can create reports that offer a comprehensive view of their data, enabling them to identify trends, patterns, and anomalies more easily.
Power BI also offers advanced features such as natural language Q&A and alerts, allowing users to quickly and easily explore their data and stay informed about critical KPIs.
Designing Dashboards
Designing dashboards in Power BI involves pinning visuals from reports, arranging them on a single page, and customizing their appearance and interactivity to provide a comprehensive view of the data.
Users can create dashboards that combine data from multiple sources, offering a centralized location for monitoring key performance indicators (KPIs), tracking progress, and making informed decisions.
Dashboards in Power BI are highly interactive, allowing users to drill down into the data, apply filters and slicers, and explore the underlying data in real-time.

By designing dashboards that effectively visualize and communicate their data, users can empower their teams to make better decisions, drive performance improvements, and achieve greater business success.

Power BI Service: Cloud-based Collaboration and Sharing
Power BI Service is a cloud-based platform that enables users to share and collaborate on reports and dashboards, extending the capabilities of Power BI Desktop and making it accessible to a wider audience.
With the integration of Power BI Report Server, users can now benefit from enhanced on-premises report management and sharing capabilities, as well as Power BI services for cloud-based solutions.
We will now delve into the features and benefits of Power BI Service, including how it aids in report publishing and sharing, as well as the creation of collaborative workspaces.
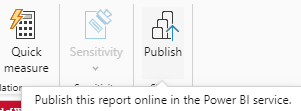
Publishing and Sharing Reports
Users can publish reports from Power BI Desktop to Power BI Service, making them accessible to others for viewing and collaboration. Once a report is published, users can share it with individual users, groups, or the entire organization, depending on their needs and permissions.
Sharing options in Power BI Service are highly customizable, allowing users to control access to their reports and dashboards, ensuring that sensitive information remains secure and confidential.
By publishing and sharing reports in Power BI Service, users can foster a data-driven culture within their organization, enabling teams to collaborate more effectively and make better decisions.
Collaborative Workspaces
Collaborative workspaces in Power BI Service are areas where users can work together on reports and dashboards, sharing data and insights with their colleagues.
These workspaces offer features such as version history, comments, and access control, enabling teams to collaborate efficiently and effectively on their data projects.
Power BI Service provides collaborative workspaces where teams can work on reports and dashboards together. It also offers granular access control to ensure data security.
By creating collaborative workspaces in Power BI Service, users can streamline the sharing and collaboration process, ensuring that everyone in the organization has access to the data and insights they need to drive business success.

Securing Data with Power BI Gateway
Power BI Gateway is a tool that securely connects on-premises data sources to Power BI Service, ensuring data security and compliance.
Next, we will look into the different types of Power BI Gateway and the process of setting up and managing the gateway, facilitating users to securely access their on-premises data sources via the cloud.
Power BI Gateway Types
Power BI Gateway comes in two flavors: personal mode and enterprise mode. There are two types of Power BI Gateway: Personal Gateway for individual users and On-premises Data Gateway for organizations.
The Personal Gateway enables individual users to securely access data from on-premises sources, while the On-premises Data Gateway is designed for organizations that need to securely access data from multiple on-premises sources, ensuring data security and compliance.
Configuring and Managing Power BI Gateway
Configuring and managing Power BI Gateway involves the following steps:
- Download the gateway software from the Power BI website.
- Install the gateway software on a local machine.
- Configure the gateway settings to connect to your on-premises data sources.
- Set up data source connections.
- Monitor gateway performance and usage.
Once the gateway is configured, users can schedule data refreshes, assess gateway performance, and monitor gateway usage, ensuring that their on-premises data sources remain up-to-date and accessible in Power BI Service.
By configuring and managing Power BI Gateway, users can securely access their on-premises data sources from the cloud, enabling seamless integration and collaboration across their organization.

Enhancing Power BI Capabilities with Additional Components
Power BI offers additional components to enhance its capabilities and provide a more comprehensive and seamless user experience. We will now discuss Power BI Mobile Apps and Power BI Embedded, two substantial components that bolster the functionality of Power BI, enhancing its versatility and efficacy as a business intelligence platform.
Power BI Mobile Apps
Power BI Mobile Apps enable users to access reports and dashboards on iOS, Android, and Windows devices, providing real-time insights and analytics on the go.
These native mobile applications allow users to securely access and view live Power BI dashboards and reports from their mobile devices, enabling them to stay informed and make data-driven decisions even when they are away from the office.
By leveraging the power of Power BI Mobile Apps, users can take their data analytics to the next level, ensuring that they always have the information they need, wherever they are.

Power BI Embedded
Power BI Embedded enables developers to integrate Power BI reports and dashboards into custom applications, providing seamless analytics and visualization experiences for end-users.
By incorporating embedded analytics into their applications, Power BI developers can offer their users powerful data visualization and analytics capabilities, allowing them to make data-driven decisions within the context of their own applications.
Power BI Embedded offers a flexible pricing model, making it an attractive option for organizations looking to enhance their custom applications with advanced data analytics and visualization capabilities.
By leveraging the power of Power BI Embedded, or other embedded analytics solutions (such as Zuar Portal), organizations can provide their users with a seamless and integrated analytics experience, driving better decision-making and business success.

Going Beyond Power BI Architecture
Getting your Power BI architecture optimized for your business is an important element of your overall data strategy. However, Power BI architecture is just one aspect of overall data architecture.
Data architecture is crucial because it provides the foundation for organizing and managing data efficiently, enabling organizations to make informed decisions, ensure data quality, and support business processes effectively.
Consulting with data experts is one of the best ways of optimizing your data architecture. At Zuar, we have a team of data experts experienced in helping companies transform their data architecture.
They can also show you how our solutions (Portal and Runner) can modernize your Power BI and overall data architecture.
Learn more by scheduling some time with one of our data experts!
 Team Zuar