Overview
Data modeling in Power BI has transformed the way businesses analyze and visualize their data, providing a powerful tool for organizations to gain insights and make informed decisions.
But what exactly is data modeling in Power BI, and how can it help you unlock the full potential of your data to drive revenue?
This beginner's guide to data modeling in Power BI will take you on a journey through the fundamentals, guiding you from the very basics to more advanced techniques. By the end, you will have the tools and knowledge to create data models that drive insightful visualizations and inform critical business decisions.
Key Takeaways
- Data modeling in Power BI is essential for efficient data organization and powerful insights.
- Optimizing data models improves performance and user experience.
- It involves understanding tables, relationships, cardinality, and cross-filter direction to build models.
- Advanced techniques such as active/inactive relationships, USERELATIONSHIP measures, custom calculations using DAX, and optimizing key columns can unlock the full potential of data.
Related Article:
 Team Zuar

Understanding Data Modeling in Power BI
Data modeling in Power BI is the process of creating visual representations of data structures, relationships, and properties. It is primarily based on the connections between tables, representing data from one or more sources, which forms the basis of precise and efficient Power BI reports.
The core concepts of data modeling in Power BI, especially when working with multiple data sources, include:
- Star schemas
- Primary and foreign keys
- Cardinality
- Cross-filter direction
- Active and inactive relationships
Mastering these concepts will equip you to formulate powerful data models that support comprehensive data analysis and insightful data visualization.
But why is data modeling so important in Power BI? Data modeling is the backbone of Power BI reporting, as it facilitates the creation of visual representations of data structures, relationships, and properties.
Constructing efficient data models guarantees that your Power BI reports are accurate, informative, and comprehensible, thus enabling your business users to make confident data-driven decisions.
However, given the complexity of Power BI data modeling, we recommend consulting with data experts, such as Zuar's team of data consultants.
Consulting with our data experts before creating data models in Power BI is wise because we can help to ensure data quality, help you understand the data, and help you create efficient and scalable data architecture, in Power BI and beyond.
The Role of Data Modeling in Power BI
Data modeling plays a crucial role in Power BI by enabling efficient data exploration, improving performance, promoting accurate reporting, and ensuring easier future maintainability.
A well-structured data model in Power BI enables users to create reports with improved scalability and enhanced future maintainability, making it an essential aspect of effective data visualization in Power BI.
Investing time and effort into building a robust data model lays the foundation for a seamless data analysis experience.
This not only benefits your Power BI reports but also empowers your business users to explore data with confidence and derive meaningful insights from it.
Key Components of Data Modeling
Key components of data modeling in Power BI include:
- Tables: the building blocks of your data model and can be thought of as containers for your data
- Relationships: established through primary keys, which uniquely identify each row in a table, and foreign keys, which are used to establish relationships with primary keys in other tables
- Cardinality: describes the relationship between two columns or tables, defined by the number of unique values in one table and the number of unique values in another
- Cross-filter direction: determines how filters applied to one table affect the data in related tables
Establishing the correct cardinality and cross-filter direction is crucial for accurate data aggregation and filtering.
The cross-filter direction in Power BI data modeling determines the direction in which filters will propagate. The most common relationship type in Power BI data modeling is one-to-many (1:N), where one record in the first table is associated with one or more records in the second table.
Understanding and properly configuring these key components allows you to craft powerful and efficient data models, thus ensuring your Power BI reports provide the necessary insights to propel your business forward.

Building Data Models with Power BI
Building data models in Power BI involves importing data from multiple sources, establishing relationships between tables, and designing star schemas for efficient data organization.
The process begins with adding all data sources in the new report option, selecting the desired data source, and clicking the 'Connect' button.
Once the data is imported, you can establish relationships between tables and design star schemas, which are layouts for tables in a data model that follow a waterfall approach, with lookup tables at the top and fact tables beneath them.
Importing Data from Multiple Sources
Importing data from various sources allows Power BI to connect and analyze data from different systems and platforms. This can be accomplished by utilizing the 'Get Data' feature in Power BI Desktop, which enables you to select and connect to different data sources with ease.
In addition, you can consolidate queries from multiple sources by connecting to each data source individually and then utilizing the 'Merge queries' feature to combine the queries.
With the ability to import data from multiple sources, you can create a truly comprehensive data model that provides a holistic view of your organization’s data landscape. The following are the common sources within the Power BI.

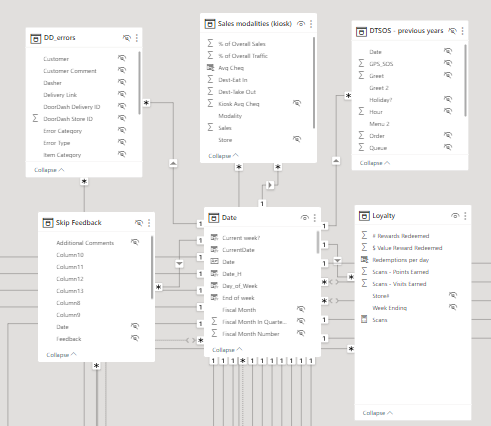
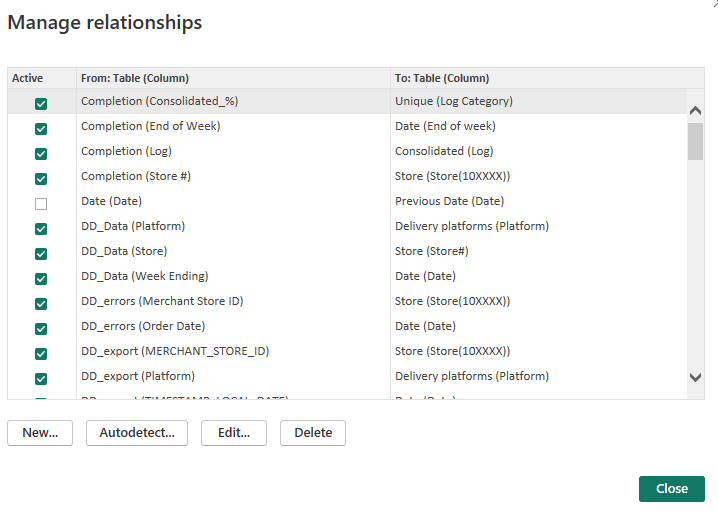
Establishing Relationships Between Tables
Establishing relationships between tables in Power BI enables users to create reports and visualizations using data from multiple tables. This is accomplished by connecting related tables based on common columns, such as primary and foreign keys.
For example, a relationship might be established between a Products table and a Financials table by connecting the unique values from the Products table to the Financials table.
To establish a relationship between two objects in Power BI, simply drag a line between the shared columns.
Establishing relationships between tables provides the ability to:
- Create powerful visualizations and reports that combine data from different tables
- Provide a comprehensive view of your data landscape
- Empower your business users to explore data with confidence
- Derive meaningful insights from it
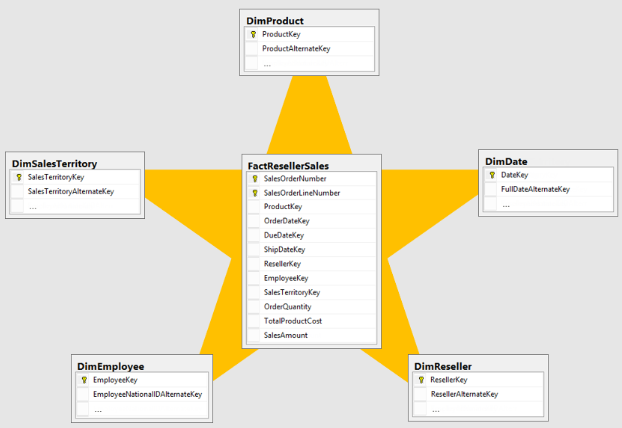
Designing Star Schemas for Efficient Data Modeling
Designing star schemas in Power BI data models helps improve performance, flexibility, maintainability, and usability.
A star schema is a data organization strategy that involves having fact tables at the center of the star, with dimension tables radiating from it. This layout provides a more intuitive and user-friendly experience for end-users, enabling them to easily navigate through the data model and explore data at varying degrees of detail.
Incorporating star schemas into your Power BI data models ensures an efficient and navigable data model, providing a seamless data analysis experience for your business users.

Optimizing Power BI Data Models
Optimizing Power BI data models involves ensuring proper cardinality and cross-filter direction, utilizing calculated columns and tables, and managing time-based data effectively.
Mastering these optimization techniques allows you to create efficient and precise data models that provide powerful insights and promote informed decision-making.
Ensuring Proper Cardinality and Cross Filter Direction
Proper cardinality and cross-filter direction in Power BI data models ensure accurate reporting and efficient performance.
It’s important to understand the implications of the cardinality and cross-filter direction you choose, as this can significantly impact the accuracy of your reports and the performance of your data model.
Utilizing Calculated Columns and Tables
Calculated columns and tables in Power BI data models allow users to create custom calculations and combine data elements using Data Analysis Expressions (DAX).
Creating a calculated column can be accomplished by utilizing the 'New Column' feature, entering the desired DAX formula in the formula bar, and defining the calculation. The calculated column will then be generated and the values calculated row by row in the data table.
To create calculated tables, the CALCULATETABLE function in DAX can be employed, enabling the evaluation of a table expression in a modified context.
Leveraging calculated columns and tables allows you to introduce new data, perform calculations, and generate visuals in Power BI, thereby providing powerful insights and promoting informed decision-making.
Managing Time-Based Data in Power BI Data Models
Managing time-based data in Power BI data models enables users to drill down through time hierarchies and analyze data at different levels of granularity.
This can be accomplished by incorporating time-based data into your data model and utilizing the auto date/time option in Power BI Desktop or designating a table as a date table, which allows for the creation of date-related visuals and the execution of time-based analysis and calculations.
Effectively managing time-based data in your Power BI data models allows for the creation of powerful visualizations and reports, providing in-depth insights into your organization’s performance over time. This, in turn, empowers your business users to explore data with confidence and derive meaningful insights from it.
However, these hidden tables are essentially calculated tables, and their presence will contribute to an expansion in the model's size. Then, it should be used only when it is necessary.

Advanced Data Modeling Techniques in Power BI
Advanced data modeling techniques in Power BI include working with active and inactive relationships, leveraging USERELATIONSHIP measures, and optimizing key columns for better performance.
Mastering these advanced techniques allows you to enhance your data analysis capabilities and create even more powerful and efficient data models in Power BI.
Active and Inactive Relationships in Power BI
Active and inactive relationships in Power BI allow for multiple connections between tables, enabling users to switch between different relationships for specific calculations.
In Power BI, only one active relationship can exist between two tables at a time. Active relationships are used to filter data from one table to another, while inactive relationships prevent data from flowing between tables.
To utilize inactive relationships, you can create USERELATIONSHIP measures or complete an additional Date dimension table.
Understanding and working with active and inactive relationships in Power BI allows you to create data models with greater flexibility in calculations and visualizations, thereby providing a more comprehensive view of your data landscape.

Leveraging USERELATIONSHIP Measures
USERELATIONSHIP measures in Power BI enable users to activate inactive relationships for specific calculations using DAX expressions. This can be particularly useful when you need to perform calculations using a relationship that is not active by default.
The USERELATIONSHIP function in Power BI can be utilized to substitute another relationship for a calculation in lieu of the active relationship.
Optimizing Key Columns for Better Performance
Optimizing key columns in Power BI data models improves performance and ensures efficient data retrieval and processing. This can be accomplished by:
- Selecting the appropriate data types
- Optimize prefix and suffix of columns
- Setting the correct cardinality
- Deploying suitable data compression techniques
- Eliminating superfluous columns and rows
- Grouping by and summarizing data using the GROUP BY and SUMMARIZE functions
- Utilizing custom columns as needed
Optimizing key columns in your Power BI data models, including the proper use of primary key, allows for the creation of efficient and precise reports, providing powerful insights and promoting informed decision-making.

Implementing Power BI Data Modeling
Data modeling in Power BI is a powerful tool that enables organizations to unlock the true potential of their data and is an integral part of organizations' data strategy.
However, creating, optimizing, and maintaining these data models is a daunting task for many data teams. That's where Zuar's data services come in.
Our expertise can help to minimize errors, maximize your data's potential, and ensure long-term viability, ultimately leading to more accurate and valuable reports and dashboards. We'll make sure you get your Power BI data models right the first time.
Furthermore, you can utilize Zuar's solutions to create an end-to-end automated data pipeline with Zuar Runner, and provide secure global access to your enterprise-wide analytics to executives, employees, partners, vendors, customers, and more with Zuar Portal.
Set up some time with one of our data experts, and we can show you how to maximize the capabilities of Power BI and help you turn your data into revenue:
Team Zuar Team Zuar