What Is Retail Analytics?
Retail analytics refers to the process of collecting, analyzing, and extracting insights from retail data to drive smarter business decisions.
With the rise of big data and advanced analytics capabilities, retail analysis has become a pivotal function for retailers of all sizes. Implementing a robust retail data analytics strategy provides numerous benefits:
- Enhanced customer understanding through analysis of customer behaviors, needs, and preferences. This enables more personalized marketing and optimized shopping experiences.
- Improved inventory and supply chain management through demand forecasting, inventory optimization, and analysis of purchasing trends. This leads to reduced out-of-stocks, better allocation of inventory, and optimizations in supply chain logistics.
- Optimization of pricing and promotions through elasticity modeling, price optimization, and testing. This allows retailers to drive profitability by aligning pricing to consumer demand.
- Performance measurement through KPI tracking across channels. Detailed metrics provide visibility into what's working well and what needs improvement across stores, ecommerce, mobile, etc.
- Location analytics to optimize trade area performance, site selection, and marketing outreach. Geospatial analytics deliver location intelligence to guide operational and strategic decisions.
- Reduced shrinkage and loss through analysis of loss trends and exceptions. Identifying problem areas allows corrective actions to be taken.
With many retail businesses struggling to adapt to the rise of ecommerce and shifts in consumer preferences, a data-driven approach enabled by retail analytics has become a competitive necessity.
Retailers can use data insights to better understand customers, optimize operations, and strategically position retailers to thrive in an increasingly complex retail landscape.

Current State of Retail Analytics
The adoption of analytics in retail has accelerated in recent years as more retailers use data insights to gain a competitive edge and better understand their customers in a rapidly evolving landscape.
However, many retailers still face challenges with harnessing the true potential of their data.
Research conducted by the Retail Industry Leaders Association reveals that a mere 20% of retailers fully leverage the capabilities of data analytics.
Common problems include data silos, poor data quality, lack of skills, and limited ability to derive actionable insights. Legacy systems and fragmented architecture also hinder advanced analytics initiatives.
Despite these challenges, leading retailers are pushing the boundaries of what's possible with analytics. From predictive modeling to experimentation at scale, techniques like reinforcement learning and graph analytics are helping leading retailers create hyper-personalized customer experiences.
Still, most retailers have yet to tap into the full opportunity. Success requires strong executive backing, organizational change management, updated data infrastructure, and teams with specialized analytics skills.
With the right vision and investment, analytics can help transform retail operations, e-commerce performance, customer experience, and overall profitability.

Data Sources for Retail Analytics
Retailers have access to a wealth of data that can empower analytics efforts.
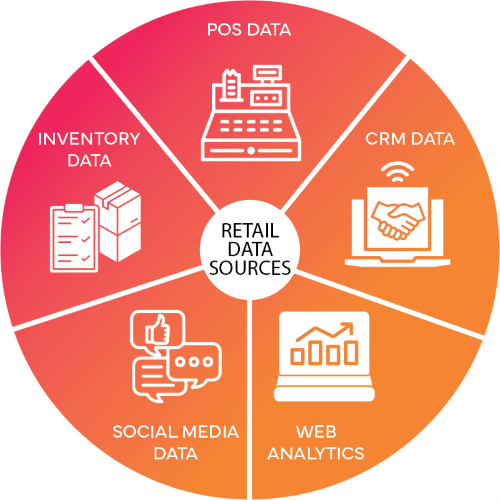
Here are some of the key data sources:
- POS Data - Point-of-sale (POS) systems capture transaction data at the checkout counter. This provides insight into sales, units sold, product mix, average transaction size, and more. Granular POS data enables item-level analysis.
- Inventory Data - Inventory systems track product availability across the retail chain. This data reveals turns, stockouts, waste, and other key operational metrics. Inventory analytics identifies best and worst-selling items, optimizes product assortment, and improves inventory planning.
- CRM Data - Customer relationship management (CRM) systems contain customer profiles with demographic, contact, and transactional data. CRM data powers customer analytics to identify high-value customers, segment customers, calculate lifetime value, and target marketing campaigns.
- Social Media Data - Social media platforms are a data goldmine for retailers. Analyzing social data reveals brand sentiment, competitors' positioning, and product trends. Retailers mine social data for consumer insights to guide marketing, product development, and other initiatives.
- Web Analytics - Website and mobile analytics provide a wealth of shopper data. Key metrics include traffic sources, on-site search terms, page views, bounce rates, and online conversions. Online behavior data enables personalized recommendations and site optimization.
Retail organizations need to aggregate and analyze data from across all these sources to enable impactful retail analytics programs. Integrating disparate data silos provides a single source of truth and 360-degree customer view.

Critical KPIs to Track in Retail Analytics
Retailers today have access to more data than ever before to track key performance indicators (KPIs) and measure success. But in the sea of available data points, focusing on the most critical KPIs is essential to maximize impact.
Here are some of the most important KPIs for retail analytics:
Sales
Total sales revenue is, of course, a crucial metric. But more granular sales data is hugely beneficial too. Look at sales by channel, store, product category/SKU, brand, campaign, and more.
Identify high and low performers to optimize marketing, merchandising, and inventory.
Traffic
In-store and website traffic reveal how many customers you attract and how engagement differs by location and marketing efforts. Traffic KPIs include:
- Website sessions and users
- Store foot traffic
- Traffic source (on-site search, referrals, social, email, etc)
Conversion Rate
The percentage of visitors that convert into customers is a powerful measure of sales effectiveness. Conversion rate KPIs include:
- Website conversion rate
- Sales conversion rate per store
- Email campaign conversion rates
- Call center conversion rates
Average Order Value
While conversion rate shows how many customers buy, average order value (AOV) measures how much revenue you earn per customer. Combining AOV and conversions illustrates revenue opportunity.
Basket Size
For online and in-store purchases, average basket size shows the number of items purchased per transaction. Track this metric by traffic source, store location, and other segments.
Monitoring these essential KPIs provides insight into sales, traffic, customer behavior, and more to enhance decision-making across retail organizations. Leveraging retail analytics platforms makes accessing and acting on KPIs easier than ever.

Data Visualization Best Practices
Data visualization can make insights accessible and engaging for decision-makers across the organization.
However, not all visualizations are created equal in effectively communicating data stories and driving key actions. Keep these best practices in mind when designing your retail analytics dashboards and reports:
Start with the why. Define what insights are needed and what decisions the visual should inform before selecting the type of visualization. Pick the type of chart that will best highlight the relationships and patterns in your data. Example types: bar charts, line graphs, interactive maps, scatter plots, etc.
Simplify layouts. Avoid clutter and remove elements not critical to conveying the key information. Use titles, legends, and annotations strategically, not just as decorations. Every added data point and design element should serve a purpose. Keep color schemes minimal and consistent.
Prioritize key indicators. Draw attention to the most significant metrics and dimensions. Visualize no more than 3-5 KPIs per chart, and use size, labels, and position deliberately.
Make comparisons clear. If charting changes over time, include context like benchmarks or goals. Encode metrics consistently across charts. Align axes across multiple charts for easier visual comparison.
Draw attention to insights. Use highlighting, annotations, reference lines, or visual elements to direct focus to key takeaways, anomalies, or opportunities hidden in the data. Don't just make your audience sift through all the data unguided.
Consider functionality. Enable sorting, filtering, or drill-down interaction to allow users to explore the data from different perspectives. But avoid overly flashy, distracting animations.
Following visualization best practices allows you to turn your retail data into impactful stories that drive smarter decisions.

Advanced Analytics Techniques
Retailers have access to more data than ever before. But simply collecting and visualizing data is just the start. To gain true insights, retailers need to apply advanced analytics techniques. Here are some of the most important ones to consider:
Forecasting
Forecasting models can help retailers predict future sales, inventory needs, and customer behavior. Time series models like ARIMA are useful for short-term forecasts based on historical sales patterns.
Causal forecasting looks at predictors like promotions, price changes, and events to estimate future outcomes. AI-powered forecasting tools can surface nonlinear patterns to improve accuracy. With better forecasts, retailers can align inventory, supply chain, marketing, and operations.
Segmentation
Dividing customers into segments allows for more personalized marketing and merchandising. Retailers can segment by demographics, purchase history, channel preferences, geography, and many other factors.
Advanced segmentation may incorporate machine learning to find hidden patterns. Dynamic segmentation analyzes behavior in real time. For example, if a customer's web browsing shows intent for an upcoming trip, they can be targeted with relevant offers.
Predictions
Retail analytics isn't just about reporting on the past. Advanced models can make predictions about the future.
For example, uplift modeling identifies customer response to specific offers, churn models predict the likelihood of customer attrition, and recommendation engines forecast which products each customer will likely purchase.
Predictions enable retailers to take proactive actions to influence future outcomes. The most accurate models involve a combination of machine-learning algorithms and human insight.
With the right data foundation in place, advanced analytics takes retail intelligence to the next level. Techniques like forecasting, segmentation, and predictions move retailers from reactive to proactive.
Prescriptive analytics can even recommend the optimal actions to achieve desired outcomes. However, advanced analytics requires investment in skilled analysts, modeling tools, and change management. The high-impact insights uncovered are well worth the effort for forward-thinking retailers.

Creating a Retail Analytics Strategy
Watch this video from Zuar Co-Founder & Principal, Joel Stellner, where he outlines three ideas for creating an effective strategy for retail analytics:

Retail Analytics Tools
We'll now focus on a few types of retail analytics software that can be utilized to gain actionable insights and ultimately increase revenue.
We'll look at three different vendors—highlighting their key features and how they can transform retail operations.
Zuar Runner and Zuar Portal: The Ultimate Retail Analytics Duo
Zuar Runner and Zuar Portal represent the forefront of retail analytics, providing a seamless, integrated platform designed to streamline data analysis and visualization for retail businesses.
Zuar Runner automates data workflows, allowing for the efficient extraction, transformation, and loading (ETL) of data from diverse sources. This automation capability ensures that retail businesses can access up-to-date and accurate data, crucial for making informed decisions swiftly.
Zuar Portal serves as an easy-to-use analytics dashboard portal that offers real-time insights into retail operations. From tracking sales performance and customer engagement to inventory management, Zuar Portal provides a comprehensive view of retail metrics through intuitive and customizable dashboards.
Being a white-label platform, retailers can brand it with their own logo and visual identity, making it seamlessly integrate into their existing digital infrastructure.
If you want to give Zuar Portal a spin, click here to try out the demo, or to explore more advanced features, click here to start a free trial!
The combination of Zuar Runner and Zuar Portal offers a powerful analytics framework that supports data-driven decision-making, enabling retailers to optimize their strategies for sales, marketing, and supply chain management.
Learn more about Zuar's Retail Solutions:

SAS Retail Analytics: Advanced Analytics for the Retail Sector
SAS Retail Analytics brings advanced analytics capabilities to the retail industry, offering solutions that cover customer intelligence, merchandising, and supply chain optimizations.
Its retail predictive analytics and AI-driven insights help retailers forecast demand, manage inventories efficiently, and personalize customer interactions, leading to improved sales and customer loyalty.
IBM Watson Commerce Insights: AI-Powered Retail Insights
IBM Watson Commerce Insights leverages AI to provide real-time insights into customer behavior, inventory levels, and market trends.
Its powerful analytics engine helps retailers understand the customer journey across channels, enabling them to make informed decisions that enhance the shopping experience and optimize inventory management.

Retail Analytics Implementation
Implementing analytics for retail requires careful planning and execution. Here are the key steps for adopting an effective analytics program:
- Assemble a Dedicated Team - Appoint an analytics leader and team to own the program. Include both technical and business experts who can identify key questions, interpret data, and drive actions. Consider skills in statistics, business analysis, data engineering, and translating insights.
- Take Inventory of Your Data Assets - Document all existing data sources, types, and accessibility. Common sources are point-of-sale systems, customer databases, inventory systems, e-commerce platforms, CRM software, etc. Identify gaps where additional data collection would help.
- Set Your Analytics Goals - Define the critical business questions you want to answer with analytics, such as improving conversions, reducing churn, optimizing assortment, etc. Connect goals to metrics and KPIs that will measure progress. Prioritize opportunities with the biggest potential impact.
- Build the Analytics Infrastructure - Create data pipelines to move, transform, and model data. Set up a BI platform and reporting dashboard to track KPIs. Ensure flexible scalability for future needs. Leverage cloud services to reduce costs. Implement data governance and access controls.
- Develop In-House Expertise - Invest in analytics training for both technical and non-technical employees. Foster data literacy across the organization. Hire specialists like data scientists and business analysts as needed. Create a center of excellence.
- Act on the Insights - Embed analytics into everyday decision-making. Build a culture that values evidence and experimentation. Continually optimize and innovate based on the data. Automate insights with predictive analytics and machine learning where feasible.
- Measure Results and Iterate - Track the performance of analytics initiatives. Demonstrate business impact. Refine approaches based on feedback and new questions. Expand analytics into new areas. Maintain focus on driving real value.

Challenges and Pitfalls to Avoid
Implementing retail analytics comes with some common challenges and pitfalls that retailers should be aware of. Avoiding or mitigating these issues is key to getting the most value from your analytics program.
Data Silos
Retailers often have data spread across various systems and databases like POS, e-commerce, CRM, inventory management, etc.
Bringing this disparate data together into a unified view is critical for getting a complete picture of customers and performance. Lack of data integration leads to blindspots and lost opportunities.
Dirty Data
Bad data quality hampers the accuracy and reliability of retail analytics. Issues like incomplete data, errors, outdated information, duplication, etc., can undermine insights.
Retailers need to invest in data governance, cleansing, and management to trust the output of analytics.
Not Actionable
Retail analytics that does not lead to any action loses its purpose. Reports and dashboards full of vanity metrics fail to impact decisions or outcomes. Analytics should be connected with operational workflows and key business priorities to drive real value.

Benefits of Retail Analytics
Retail analytics presents an enormous opportunity for retailers to gain a competitive edge. By leveraging data and analytics, retailers can optimize everything from inventory management to marketing campaigns.
The key opportunities include:
- Competitive Advantage - Retail analytics enables data-driven decision-making. Retailers that master analytics can outperform the competition by optimizing pricing, promotions, product assortment, staffing, and more. They gain insights faster and adjust strategies to maximize performance.
- Inventory Optimization - With analytics, retailers can accurately forecast demand to minimize excess inventory. They can optimize inventory levels across locations. Retailers can also use analytics to minimize out-of-stocks and optimize product availability.
- Enhanced Customer Experiences - By analyzing customer data, retailers can better understand customer needs and preferences. They can tailor promotions, recommendations, and experiences to drive brand loyalty. Location analytics helps optimize store layouts.
- Improved Marketing Effectiveness - Retailers can test and analyze the results of campaigns to determine the most effective strategies. They can target marketing efforts more precisely based on customer insights.
- Loss Prevention - Analyzing point-of-sale data, inventory data and other sources helps identify sources of shrinkage like theft, fraud or process gaps. Retailers can take preventative action and reduce loss.
- Labor Cost Optimization - Retailers can use analytics to predict store traffic patterns and staff stores accordingly. Employee scheduling can be optimized based on sales forecasts.
- New Services and Business Models - Analytics insights can reveal unmet customer needs and untapped opportunities, which can inspire new services, store formats or business models.
The possibilities are endless. Retailers who embrace analytics now can unlock game-changing business value and establish a strategic competitive advantage for the future.

Retail Analytics Next Steps
Retail analytics has come a long way in recent years, offering new opportunities for retailers to gain valuable insights into customers, products, promotions, and more.
With access to detailed data on sales, inventory, web traffic, and customer behavior, retailers can track essential KPIs, identify issues and opportunities, and guide smarter business decisions.
Creating and implementing a retail analytics strategy is not an easy feat—especially if you don't have the data analytics expertise in-house. But that's where Zuar Labs comes in.
Zuar Labs is a team of data superheroes who hold the power to transform business outcomes. Through our data services, we can help you take stock of your current systems, identify gaps in your data stack, recommend solutions to fill those gaps, and assist in implementation and enablement.
Additionally, the Zuar platform provides powerful retail analytics capabilities to extract hidden insights from your data and drive better business decisions.
Meet with one of our data experts today to learn how Zuar can transform your retail analytics!
 Team Zuar
 Team Zuar