
What Is Sales Analysis?
Sales analysis is the process of evaluating your sales data to gain insights into sales performance. It involves reviewing past sales metrics and trends to understand what is working well, and what can be improved.
The purpose of sales analysis is to help sales teams and leadership make better informed decisions to optimize revenue and growth. It provides visibility into sales operations so you can identify opportunities or issues and take action.
Specifically, sales analysis encompasses analyzing:
- Sales revenue growth and profitability
- Performance by product line, sales channel, or geographic region
- Individual sales rep performance
- Sales pipeline health
- Customer retention and churn rates
- Win/loss rates on proposals and deals
- Sales forecasts and quotas versus actuals
By uncovering patterns, trends, and insights, sales data analysis helps you spot highs and lows. You can diagnostically determine where to fine-tune your strategy to maximize sales results.
It enables data-driven decision-making to improve sales processes, resource allocation, and strategic planning for the future.

The Importance of Sales Analysis

Sales analysis is crucial for several reasons:
Identify sales trends - By analyzing historical sales data, you can spot rising or declining trends. This allows you to adapt your sales strategy accordingly. For example, if you notice sales dropping over the past few months, you can dig deeper to understand why and make changes to reverse the trend.
Forecast future sales - Analyzing past sales patterns allows you to make educated projections about future sales. While forecasts are never 100% accurate, they provide an informed estimate to aid planning. For instance, you can forecast expected revenue for the next quarter based on sales cycles and seasonality.
Optimize sales processes - Diligent sales pipeline analysis can reveal bottlenecks or inefficiencies. You can then optimize based on data-driven insights, as opposed to mere guesswork. This ensures your sales processes are calibrated for peak performance.
Benchmark performance - Sales analysis provides objective data to evaluate sales reps, teams, channels, and campaigns. You can set performance benchmarks and goals based on historical trends. This drives accountability and motivates salespeople to continually improve.
In summary, sales analysis transforms disconnected data points into actionable insights. No sales organization can afford to fly blind without studying past sales patterns and trends. The time invested in regular sales analysis almost always provides a positive ROI in terms of results.

What Is a Sales Analysis Report?
A sales analysis report provides an in-depth review of all sales activities and metrics to assess performance. These reports compile data from multiple sources to identify trends, issues, and opportunities related to sales.
Sales analysis reports often contain the following key elements:
Executive summary - Highlights the key findings and takeaways from the sales analysis.
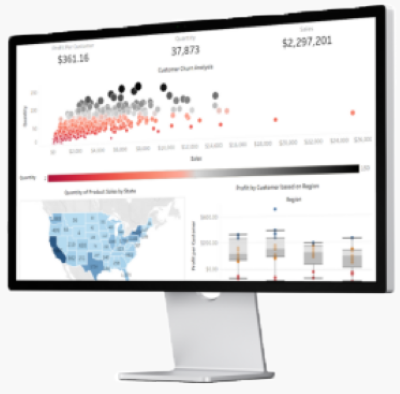
Sales data overview - Provides graphs and visualizations of total sales, sales by product/service, sales by region, sales rep performance, and other sales metrics.
Sales projections - Compares actual sales to predicted or quota sales to identify positive and negative variances.
Customer analysis - Examines metrics related to new customers, repeat customers, churn, lifetime value, and other customer behaviors.
Competitor analysis - Looks at market share compared to competitors and benchmarks pricing, products, and sales processes.
Recommendations - Suggests strategies and actions to capitalize on opportunities and address sales challenges uncovered in the analysis.
Sales analysis reports provide actionable insights based on hard sales data. The metrics and findings in these reports guide strategic decision-making around sales objectives, processes, and resource allocation. Companies aim to produce regular sales analysis reports to closely monitor performance.

Types of Sales Analysis
Sales analysis encompasses various techniques to evaluate sales performance. Common types of sales analysis include:
Trend Analysis
Trend analysis examines historical sales data to identify patterns and trends over time. This reveals increases or decreases in metrics like revenue, units sold, customer acquisition, etc.
Trend analysis enables sales teams to spot positive and negative trends, set realistic forecasts, and predict future performance.
Segmentation Analysis
Segmentation analysis divides sales data into different categories to understand the performance of each segment. Common segmentation dimensions are product, region, customer type, sales rep, channel, etc.
Analyzing metrics by these segments provides insight into which are thriving or underperforming. This helps sales leaders adjust strategy.
Benchmarking
Benchmarking compares a company's sales metrics to internal goals or external standards. Internal benchmarking might involve comparing this year's performance to last year's.
External benchmarking could mean comparing sales figures to an industry average. Benchmarking measures progress toward targets and identifies areas for improvement.
Win/Loss Analysis
Win/loss analysis examines deals that were won vs lost. This reveals why opportunities succeeded or failed and what could be done differently.
Sales teams can identify patterns in winning and losing deals. These insights enable refining of tactics and processes to improve win rates and surpass sales goals.

KPIs and Metrics to Measure Sales Performance
Sales performance can be measured using a variety of key performance indicators (KPIs) and metrics. Some of the most important ones to track include:
Revenue - This refers to the total income generated from sales. It provides an overall picture of sales performance. Tracking revenue over time can reveal growth trends and seasonal fluctuations.
Sales cycle length - The sales cycle length measures the average time it takes from initial contact with a lead to closing the sale. A shorter sales cycle indicates a more efficient selling process. This metric can highlight inefficiencies that need to be addressed.
Lead conversion rate - The lead conversion rate shows the percentage of leads that become customers. A higher conversion rate means your sales team is skilled at qualifying leads and moving them through the pipeline. A low conversion rate suggests issues with lead nurturing.
Average deal size - The average deal size tracks the mean value of deals closed over a period. Larger deal sizes can indicate you are targeting the right customers and selling premium offerings. Lower average deal sizes may signal issues with product-market fit.
Customer acquisition costs (CAC) - This sums up the total spent on marketing and sales activities to acquire new customers divided by the number of customers added. Lower CAC indicates greater sales efficiency. High CAC can prompt reviewing sales processes and realigning marketing strategies.
Monitoring these sales KPIs helps identify what's working well and what needs improvement. They provide quantitative insights to inform sales strategies and growth initiatives.
Related Article:
 Team Zuar

Sales Analysis Tools

Sales teams have access to a wide array of tools to analyze sales data. Here are some of the most popular options:
Spreadsheets
Spreadsheets like Excel remain one of the most commonly used sales analysis tools. They provide a flexible and familiar interface for manipulating data, creating charts, and running basic calculations.
Spreadsheets are a good option for straightforward analysis tasks and ad hoc reporting. However, they lack some of the robust features and automation of dedicated analytics platforms. Spreadsheet-based analysis can also be prone to human error.
CRM Systems
Customer relationship management (CRM) systems like Salesforce or HubSpot contain built-in reporting and analytics functionality.
CRM sales analysis tools allow managers to track metrics like pipeline trends, sales productivity, and win/loss rates. While convenient, CRM analysis capabilities are usually less advanced compared to standalone BI or sales analytics software.
BI Tools
Business intelligence (BI) tools like Tableau, ThoughtSpot, Qlik, and Microsoft Power BI provide interactive data visualization capabilities.
BI tools connect to data sources like CRM systems and ERP platforms to generate dashboards, charts, and reports. They enable sales teams to spot trends, segment data, and create forecasts. BI platforms provide powerful analytics but often require technical skills.
Sales Analysis With Zuar Portal and Zuar Runner
Zuar provides powerful sales analysis capabilities through its Portal and Runner automation tool. With Zuar, sales teams can gain deep insights into all aspects of their sales performance and processes.
Zuar Portal offers interactive sales dashboards that connect to your CRM and other data sources.
Drag-and-drop widgets allow you to customize dashboards with key metrics like deals won/lost, pipeline trends, sales cycle analysis, lead conversion rates, and more. These reports can then be securely shared with all stakeholders - internal or external.
Click here to try out the Zuar Portal demo. To start a free trial and get a more in-depth experience, click here!
Zuar Runner goes beyond reporting to automate repetitive sales tasks and workflows. Use Runner to set up notifications and alerts based on sales KPIs, schedule reports, sync data across systems, manage lead scoring models, and other workflows to optimize selling.
With Zuar's robust sales analysis and automation capabilities, sales teams can turn insights into action to hit targets and accelerate revenue growth.
Learn more about how Zuar can help you master your sales data:


Best Practices for Sales Analysis
To get the most out of sales analysis, here are some best practices to follow:
Automate data collection - Manually compiling sales data is time-consuming and prone to errors. Use sales analysis software to automatically pull data from your sales channels, unify it, and update dashboards. This allows you to spend time on interpretation rather than data entry.
Set goals - Establish quantifiable goals for sales targets, growth, customer lifetime value, and other KPIs. Sales analysis lets you measure performance against those goals. Setting benchmark goals also helps contextualize sales numbers.
Identify trends and patterns - Look at sales data over time to spot trends, seasonal fluctuations, and other patterns. Knowing if sales dip during the summer or peak in Q4 allows you to plan and set realistic goals. Identify best-selling products, your most valuable customers, and other trends.
Share results regularly - Don't keep sales analysis to yourself. Create dashboards to share with your sales team, executives, and other departments. Publish insights in newsletters, presentations, and meetings. When everyone has access to the same sales data, they can work together to reach goals.

Sales Analysis Next Steps
As we've illustrated, the importance of sales data analytics in today's competitive business landscape cannot be overstated.
It is the backbone of strategic decision-making, allowing organizations to understand their market position, optimize their sales processes, and forecast future trends with greater accuracy. However, achieving this level of insight requires advanced analytical capabilities, a task that can be daunting for many businesses.
This is where Zuar's data services, through Zuar Labs, come into play. Zuar Labs offers comprehensive data services tailored to meet the unique needs of your business.
Whether you are looking to streamline your data integration processes, enhance your data visualization capabilities, or leverage advanced analytics for deeper insights, Zuar has the expertise and technology to propel your business forward.
In a world where data is king, partnering with Zuar means investing in the future of your business. Get the ball rolling by talking with one of our data experts!
Team Zuar Team Zuar