What Are Data Insights?
Data insights refer to meaningful and valuable information extracted from data analysis that can be used to make informed decisions, identify patterns, and gain a deeper understanding of a given subject or situation.
Without properly harnessing and analyzing organizational data, its potential to drive growth and promote efficiency for the business falls short. Data insights serve as the key to unlocking the power that data analytics hold in making decisions.
This article explores the concept of data insights, what they are, modern ways to gather them, how to analyze data, and how to leverage them to achieve business success.
Key Takeaways
- Data insights are actionable information extracted from data analysis that provide deeper business understanding to drive growth and efficiency.
- There are four main types of data analytics - diagnostic, predictive, prescriptive, and descriptive that produce different kinds of insights.
- Best practices for generating impactful insights include defining objectives, validating findings through careful analysis, and using data visualization.
The Importance of Data Insights
The Global State of Enterprise Analytics survey reports that 94% of respondents felt that data and analytics were important to their business growth strategy.
Analyzing business data helps to understand the patterns and trends in a business’ performance. It helps to make data-backed predictions to gain a competitive advantage.
A typical example is a business that wants to increase revenue by increasing repeat purchasing by its customers.
It can do this by analyzing the customers’ data to understand their buying and purchasing behavior, which includes purchase history, buying habits and characteristics, periods of surge in sales due to increased purchases, and periods of low sales.
This information is channeled toward meeting customers’ needs and pursuing their satisfaction, and in turn helps to generate more sales and retain loyal customers for the business.

What Is the Difference Between Data and Insights?
In the modern era of data-driven decision-making, it is essential to grasp the distinction between data and insights. While these two terms are often used interchangeably, they represent distinct stages in the process of extracting value from information.
Data: The Building Blocks
Data, in its raw form, consists of facts, figures, and observations. It is the raw material that serves as the foundation for analysis and decision-making.
Data can be quantitative or qualitative, structured or unstructured. It can come from a variety of sources, such as databases, spreadsheets, or even social media platforms.
However, data on its own is not meaningful. It needs to be organized, processed, and analyzed to derive insights that can inform strategic decisions. This is where the transformative power of data comes into play.
Insights: The Key to Actionable Information
Data insights (also known as business intelligence or BI) refer to valuable information that is extracted and transformed from data through careful analysis.
They provide a deep understanding of patterns, relationships, and trends hidden within the data. Insights give context and meaning to the raw information, enabling decision-makers to identify opportunities, mitigate risks, and guide their actions.
Where data is like a puzzle, insights are like the completed picture. They provide the necessary clarity to make informed decisions and drive meaningful outcomes.
Insights bring coherence and relevance to the data, answering key questions and uncovering previously unseen connections.

What Are the Types of Data Analytics?
There are four core types of data analytics that businesses employ in their quest for growth, and from which data insights can be gathered. They include:
- Diagnostic Analysis
- Predictive Analysis
- Prescriptive Analysis
- Descriptive Analysis
Diagnostic Analysis
Diagnostic analysis is a type of data analysis that focuses on identifying the root problem or the root cause of a problem. It gathers information and insights from historical data with the aim of determining why a problem occurred.
This data analysis method can be compared to the diagnosis process between a medical doctor and a patient. The doctor asks numerous questions to the patient during the diagnosis process, with the sole aim of discovering why the patient presents with such symptoms and illness.
Predictive Analysis
Predictive analysis focuses on analyzing data and statistical models to derive insights about possible future predictions or outcomes.
This analysis method involves the use of data mining and machine learning algorithms to study trends and predict future outcomes.
A typical application of predictive analysis is the analyzing of stock market trends to gain insight into how stocks might perform in the future, based on the surrounding circumstances.
Prescriptive Analysis
Prescriptive analysis takes predictive analysis one step forward. Not only does it predict future outcomes, but it also recommends possible actions and the best course of action for the predicted occurrence.
This data analysis method leverages real-world data, analysis, experience, and business rules to attain the goal and the desired outcome of the research.
A common example of this type of data analysis is in the optimization of supply chain operations, where you take into consideration factors like demand patterns, production constraints, and transportation costs.
Descriptive Analysis
Descriptive data analysis focuses on studying historical data for essentially research's sake. The objective of this analysis method is not to gain insights to predict future outcomes or recommend actions; the only goal is to find the main features of a dataset.
This type of analysis delves deep into past trends and data to profoundly understand the subject. For example, a company doing descriptive analysis could analyze a sales dataset over a specific time period to determine information such as which products were the best-selling or which day brought in the highest revenue, fully understanding that the past has on its own cannot predict the future.

How to Get Data Insights
The methods for gathering data can be classified into traditional and modern methods.
Traditional Methods of Gathering Insights
Surveys:
This involves gathering actionable data insights through questionnaires that aim to collate data, either quantitatively or qualitatively. These surveys could be in paper or digital form.
Interviews:
This entails gathering insights or opinions on a particular subject matter. This mainly involves talking to the subject directly to get their honest feedback.
Observation:
This means observing subjects without directly involving them in the study. An example of this could be a store manager analyzing customer foot traffic in order to optimize product placement.
Modern Methods of Gathering Data Insights
Modern sources and methods of gathering data insights include the Internet of Things, mobile analytics, CRM systems and sentiment analysis. Additional methods for gathering data insights include the following:
Data Analytics Platform:
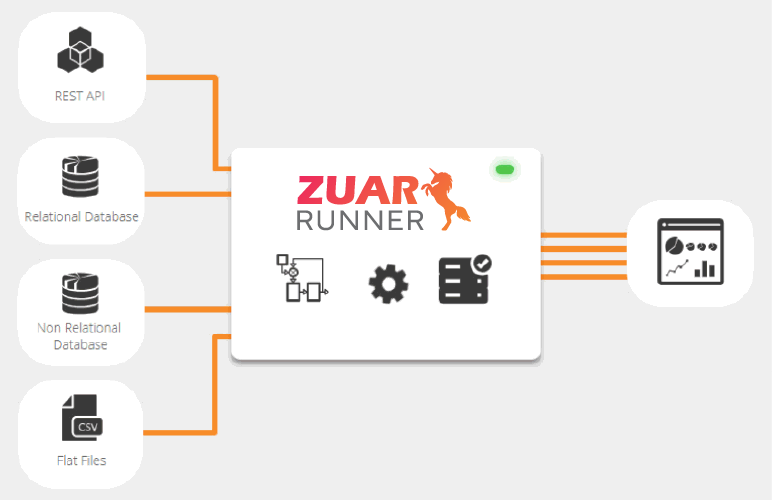
Utilizing a data analytics platform allows businesses to automate the collection, processing and analysis of vast amounts of data. Often the platform will utilize separate ETL/ELT software to bring in prepared data from various sources.
With these platforms, you can utilize tools like machine learning algorithms, statistical models, and data visualization tools to help simplify your insight exploration.
Embedded analytics software like Zuar Portal can be used to democratize the company's analytics. Such self-service tools can make it easy to share self-service analytics beyond the platform that generated them, reducing the burden those frequently called upon to create specific reports, charts, etc.
Social Media Listening:
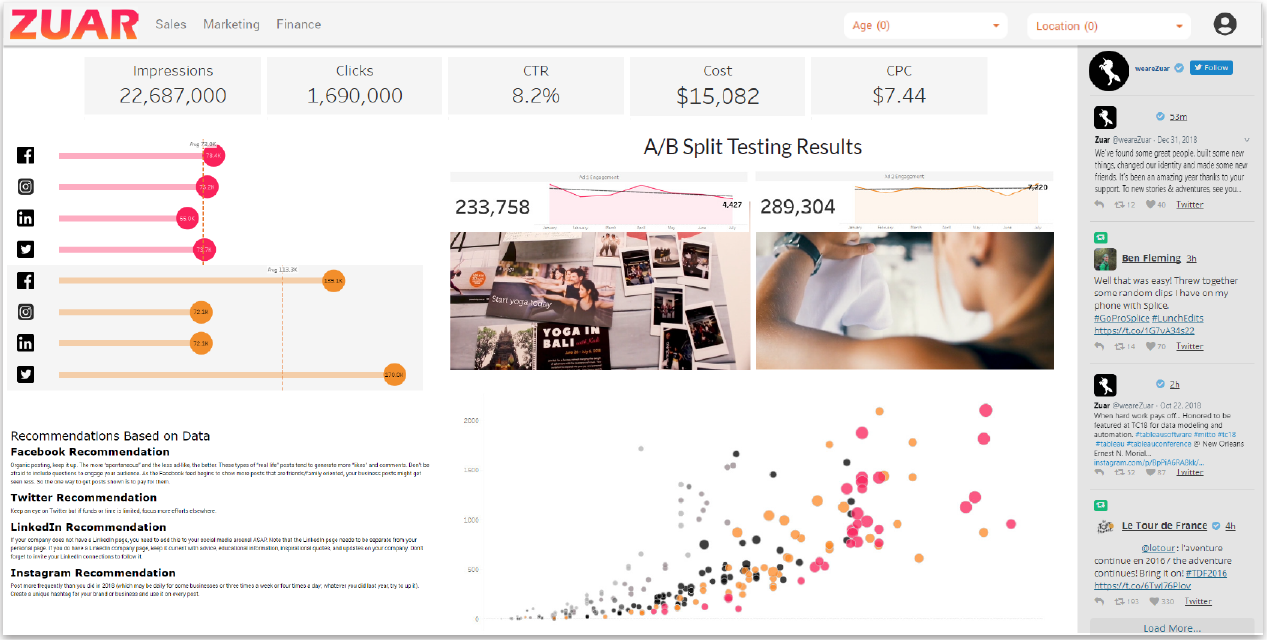
This method collects vast amounts of information about trends and opinions across social media platforms. These platforms (Facebook, LinkedIn, Twitter, etc.) contain basic tools that help you analyze customer preferences, sentiments and user engagement to gain actionable insights about specific subject matter. More robust third-party tools are available to vastly expand the collection and analysis of data from social media networks.
Web Analytics:
Web analytics, from tools like such as Google Analytics, allow you to analyze website visitor data. Types of this data include page views, impressions, and conversion rates. This data helps you gain a deep understanding of customer behavior, what appeals to their interests, and how it influences their purchase behavior.
Data Mining:
Data mining helps you assess and discover relationships within large data sets. This method uses complex algorithms and statistical models to unlock hidden insights for predictive purposes.
Take, for example, a retail company that collects a large amount of data. The company can use data mining to analyze this large dataset to determine which products are often bought together.
Using this insight, the company can place complementary items near each other to increase sales.
Collaborative Data Sharing:
Participating in collaborative data sharing with other organizations and researchers helps you attain profound insights by contributing resources and uncovering trends. It also allows you to make joint and improved decisions via a collaborative decision-making process.

What Are the Best Practices for Analyzing Data Insights?
Define Your Objectives Clearly
Before starting your data insights journey, it is essential to identify your goals and objectives.
This helps in guiding your quest, allowing you to stay on track and focused while avoiding going down unhelpful rabbit holes (which is very easy to do when presented with a plethora of data and a million ways to look at it!).
Seek Domain/Subject Matter Expertise
It is best to work with those who are knowledgeable and experienced on the subject matter. You can collaborate with domain experts and leverage their deep knowledge of the subject matter; even if it's just for a second opinion.
For example, if you're analyzing financial data you might want to connect with someone in the Finance department to confirm that you're using the correct inputs and properly interpreting the outputs.
Regarding the data collection and dissemination of analytics, Zuar is a great subject-matter expert to consult with. We have a long history of creating and implementing successful data strategies with our clients. Learn more about our data services here.
Validate Your Findings
Erroneous data can sow long-term distrust in both you and what you present to others, potentially even decreasing analytics usage within your organization. Ensure that your methods and thorough and rigorous, with little opportunity for human or other types of error.
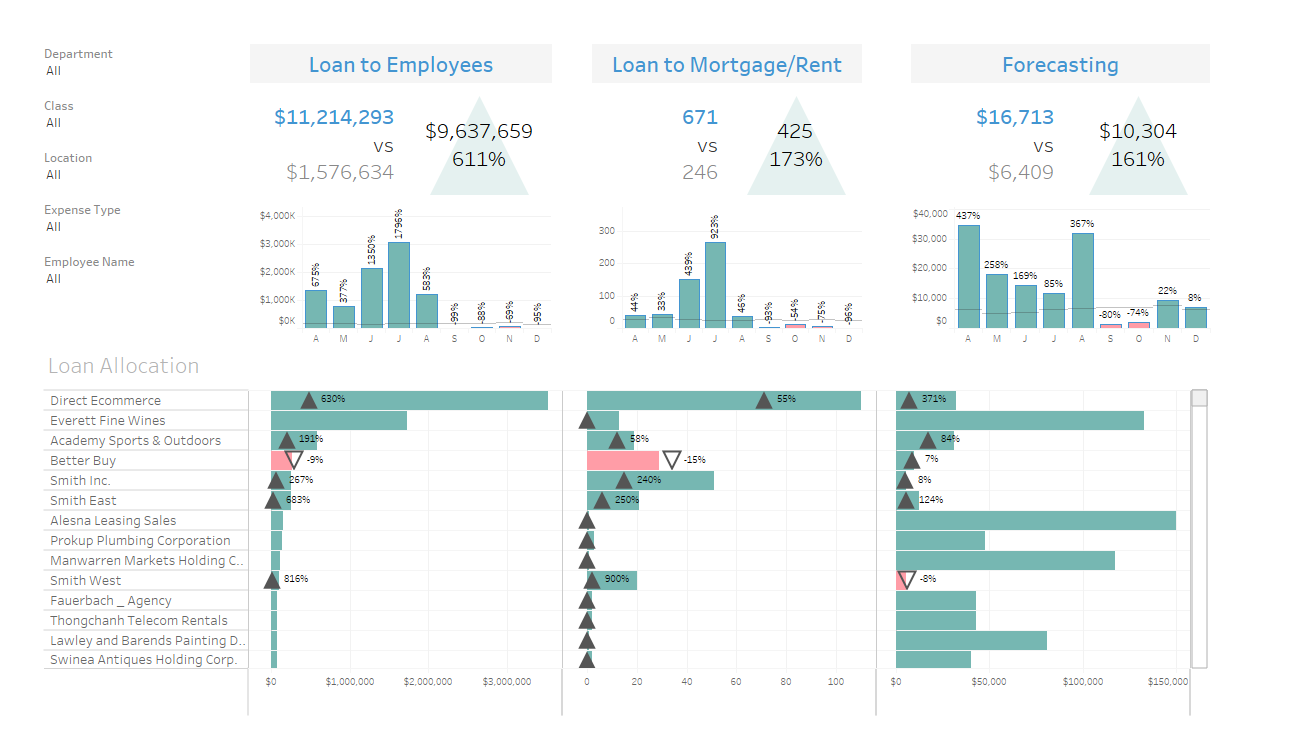
Make Use of Data Visualization Tools
Visualization is often best for displaying statistical and other complex data intuitively. Utilizing visualization tools allows you to make use of charts, graphs, drawings, and tables, as required by the data in question.

Data Insights Examples
Let's consider a multinational retail chain with stores in various locations around the country. The company has been experiencing a decline in sales over the past few months.
By analyzing their sales data, they discover a significant data insight: sales are consistently lower in specific regions during certain time periods.
Further investigation reveals that these lower sales coincide with periods of extreme weather conditions, such as heavy rainfall or severe heat waves. Customers in those regions tend to avoid visiting physical stores during such weather events, resulting in decreased foot traffic and sales.
Armed with these insights, the retail chain can take strategic actions to mitigate the impact of adverse weather conditions on sales. For instance, they can:
- Focus on increasing online marketing efforts during those periods to drive e-commerce sales.
- Adjust marketing efforts. For example, adjust messaging for areas experiencing a heat wave to something like "Get out of the heat! Come for the air conditioning, stay for the low prices!"
- Optimize inventory management to ensure adequate stock levels during non-weather-affected regions and periods.
- Explore the possibility of opening smaller pop-up stores in regions that are less impacted by extreme weather to maintain a steady revenue stream.
By leveraging data insights, the retail chain can adapt its business strategies to be more weather-resilient, potentially leading to improved sales performance and overall business profitability.

Implementing Data Insights
As this article shows, data insights can be a power growth catalyst. But getting from raw data to actionable insights can be difficult. The collection of data, preparation of the data, analysis of the data, and interpretation of the data: each part presents its own challenges.
This is where Zuar can help. Our experienced team of data experts can help you find the technologies and methods you need to turn your data into revenue, while saving both time and money on the implementation.
Meet with one of our data experts to discuss your data management strategy: