Overview
Imagine having a bird’s-eye view of your business’s most crucial data, all in one place, easily accessible and visually engaging. This is the power of a dashboard portal.
In today’s fast-paced, data-driven world, businesses need to harness the power of data to make informed decisions and drive revenue. A dashboard portal offers a comprehensive solution to visualize and analyze data, fostering collaboration, and enhancing customer experiences.
Are you ready to unlock the potential of your data and drive your business forward? Let’s dive into the world of dashboard portals.
Key Takeaways
- Dashboard portals are web-based tools that provide businesses with visualizations of key performance indicators to improve data-driven decision-making.
- Dashboard portals offer various components, types, and features for customizing the user experience in order to optimize business operations.
- Benefits include improved customer satisfaction, enhanced collaboration, and increased efficiency through data visualization and integration capabilities.

Understanding Dashboard Portals
A dashboard portal is a centralized web-based platform or interface that hosts multiple dashboards, often catering to various departments, teams, or users within an organization.
It serves as a gateway to access different dashboards, each tailored to specific needs or functions. The portal typically offers a unified view, enabling users to navigate between different dashboards without having to log in separately to each one.
This centralized hub provides a convenient and organized way for users to access, monitor, and analyze data from diverse sources, enhancing decision-making and productivity across the organization.
Key Components
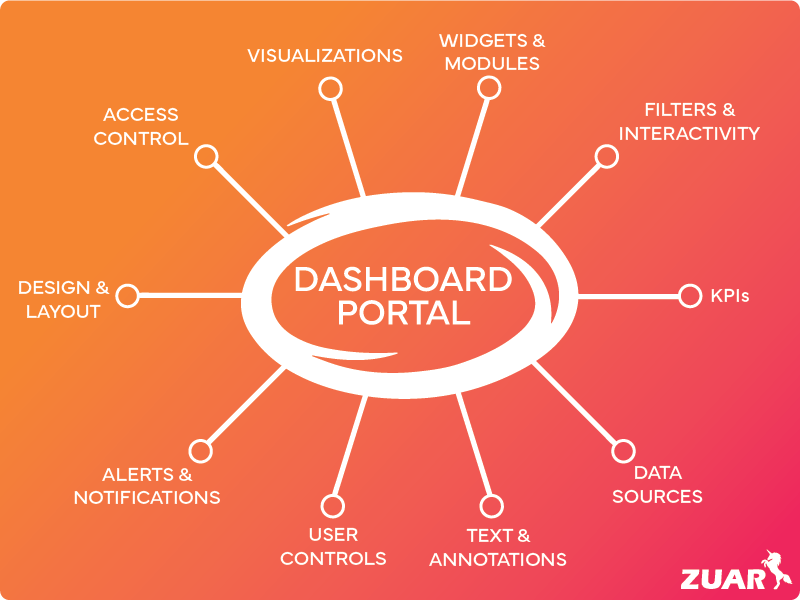
While not every dashboard portal will look the same, most will contain the following components:
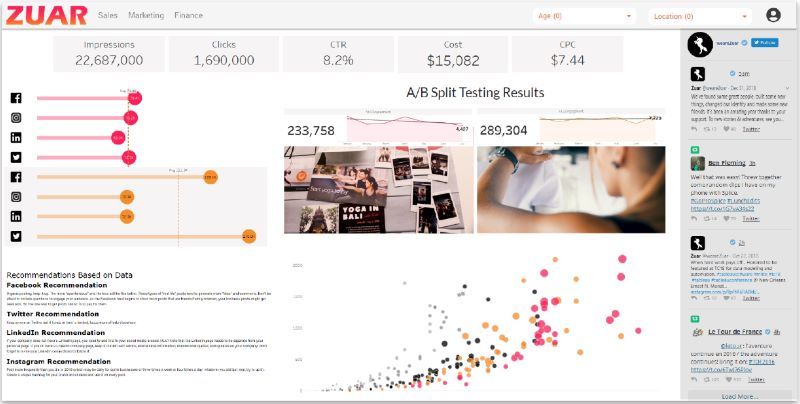
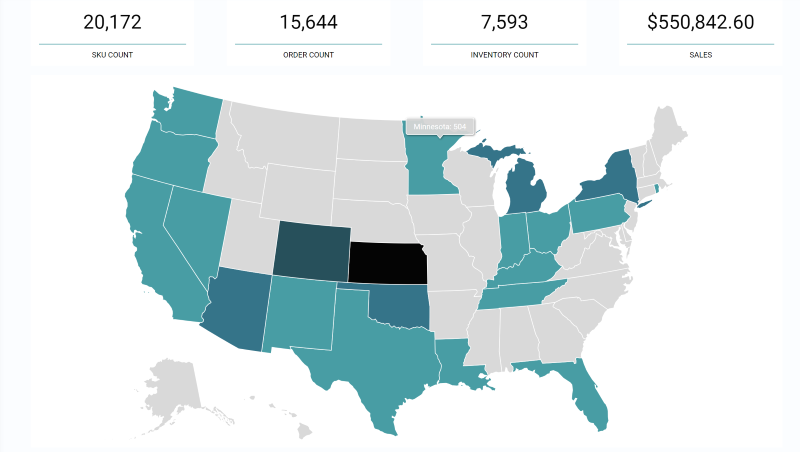
- Visualizations: Graphs, charts, and other visual elements present data in a comprehensible manner, allowing for quick insights.
- Widgets and Modules: These are individual components displaying specific data or insights, such as tables, graphs, or metrics.
- Filters and Interactivity: Tools that enable users to interact with the dashboard, allowing for filtering, sorting, or drilling down into specific data for a more detailed view.
- KPIs (Key Performance Indicators): Summary metrics or indicators that offer a quick snapshot of the most critical information related to the goals or performance of a business or system.
- Data Sources: Information on the origins of the data being displayed, offering transparency and credibility to the information being presented.
- Text and Annotations: Descriptions or explanations to provide context or additional information about the displayed data.
- User Controls: Options for personalization or customization, allowing users to tailor the dashboard to their specific needs or preferences.
- Alerts and Notifications: Features that signal noteworthy changes or triggers based on predefined conditions in the data.
- Design and Layout: The arrangement of elements and the overall aesthetic to ensure readability, accessibility, and an intuitive user experience.
- Access Control: Access control in a dashboard portal involves managing permissions to ensure only authorized users or specific roles can access relevant data, maintaining security, privacy, and compliance.
Types of Dashboard Portals
Dashboard portals come in various types, such as:
- Performance dashboards: provide an overview of an organization’s performance and progress towards its goals, monitoring KPIs and other vital metrics critical to the organization.
- Tactical dashboards: enable real-time data monitoring and analysis, offering comprehensive insights into the performance of customer service, marketing, and sales operations.
- Analytical dashboards: focus on data analysis and visualization, allowing users to explore and analyze data in depth.
- Operational dashboards: provide real-time operational data, allowing users to monitor and manage day-to-day operations.
Each type of dashboard offers different features tailored to specific business needs.

Accessing Your Dashboard Portal
One of the key advantages of a dashboard portal is its accessibility across various devices and platforms, making it easy for users to access essential data and insights anytime, anywhere.
This accessibility fosters user engagement, enabling swift decision-making as individuals can access essential data and insights on the go, improving productivity and responsiveness in dynamic work environments.
Moreover, cross-device accessibility supports a more inclusive and flexible workflow, allowing users to interact with critical information from various locations, enhancing collaboration, and ensuring that insights can be accessed and acted upon promptly, irrespective of the device being used.
With easy access to your dashboard portal, monitoring and analyzing your business data becomes a seamless and efficient process in generating a report.

Customizing Your Dashboard Portal
Personalizing your dashboard portal guarantees receipt of the most relevant and useful information, tailored to your specific needs. Customization involves:
- Altering widgets
- Adding or removing elements
- Rearranging the layout
- Selecting the most pertinent information for the user
Tailoring your dashboard portal experience allows concentration on aspects that are crucial to your business. Widgets, for instance, can typically be customized by altering their size, color, and position on the dashboard.
Additionally, you can add or remove widgets and configure the data displayed in each widget to suit your requirements. To add or remove elements, utilize drag-and-drop features for a rapid and straightforward process.
Rearranging the layout of the dashboard and filtering the data displayed in each widget allows you to select the information that best serves your business objectives.
Data Integration
Linking your dashboard portal to multiple data sources is vital for a thorough analysis. Data integration is the process of combining data from multiple sources into a unified view that can be utilized for business intelligence.
This provides businesses with a comprehensive overview of their data, enabling them to make informed decisions, enhance their operations, and foster better collaboration between teams and departments.
APIs, webhooks, and other integration methods can be used to connect a dashboard portal to data sources. Secure data transfer methods should be implemented for data accuracy, with regular testing and monitoring of data integration processes.
By integrating data from various sources, businesses can gain a holistic understanding of their operations, uncover hidden patterns, and make data-driven decisions.
Visual Customization
Visual customization modifies the visual elements of a dashboard portal according to individual preferences or branding needs, fostering a unique and personalized visual experience.
Enhancing the user experience by making the dashboard portal more aesthetically pleasing and easier to use, visual customization can also help establish a distinct brand identity and distinguish a product from its competitors.
Techniques for visual customization using tools include:
- Altering colors
- Changing fonts
- Adjusting layouts
- Modifying other design elements
Additionally, images, videos, and animations can be utilized to create a more engaging user experience. By personalizing the appearance of your dashboard portal, you not only improve its usability but also facilitate data accessibility and interpretation.
Performance Optimization
Performance optimization is crucial to boost the efficiency of your dashboard portal. Techniques such as feature selection and data generalization can be employed to reduce complexity and boost performance.
Feature selection involves selecting the most pertinent features from a dataset to use in a model, either manually or with automated algorithms.
Automated algorithms can help determine the most influential features and decrease the number of features used in the model, minimizing complexity and enhancing performance.
Data generalization involves diminishing the intricacy of a dataset by eliminating superfluous information. This can be achieved through amalgamating comparable data points or by eliminating outliers.
This technique can help reduce the size of the dataset and enhance the performance of the model, ensuring that your dashboard portal remains efficient and effective in delivering valuable insights.

Benefits of a Dashboard Portal for Businesses
Dashboard portals offer numerous benefits to businesses, including data-driven decision-making, collaborative analysis, and customer experience enhancement.
Dashboard portals facilitate the exploration of trends and patterns by offering real-time and historical insights into the business impact of communications.
This visibility into the inner workings of a business not only fosters informed decision-making but also promotes collaboration and sharing of valuable data insights among team members.
Improving customer experience is another advantage of utilizing a dashboard portal. By providing real-time insights into customer behavior, preferences, and trends, businesses can:
- Quickly pinpoint areas of improvement
- Devise strategies to better meet customer needs
- Monitor customer feedback
- Gauge customer satisfaction
- Enhance data democratization
- Continually enhance the customer experience
Data-Driven Decisions
Data-driven decisions refer to the process of utilizing facts, metrics, and data to guide strategic business decisions. By relying on data, organizations can make more precise and objective decisions, leading to enhanced outcomes and performance.
Dashboard portals can provide real-time and historical insights into how communications drive a business, enabling the exploration of trends and patterns that can be beneficial for decision-making.
Examples of decisions based on data include:
- Utilizing customer data to recognize patterns and prospects
- Utilizing predictive analytics to anticipate future demand
- Utilizing machine learning to enhance processes
By embracing data-driven decision-making, businesses can make the most of their dashboard portals and leverage data for improved efficiency and success.
Collaborative Analysis
Collaborative analysis is an approach that involves multiple stakeholders to collect, analyze, and interpret data in order to make informed decisions.

Dashboard portals serve as a platform for teams to collaborate on data analysis and gain insight, allowing them to access and share data instantly, visualize data effectively, and make informed decisions.
This collaborative process encourages inquisitiveness and enhances the exploration of new insights.
By fostering teamwork and collaboration among employees, dashboard portals can help businesses uncover hidden patterns, capitalize on new opportunities, and make better decisions. As a result, businesses can become more efficient, agile, and competitive in their respective industries.
Customer Experience Enhancement
Customer experience enhancement is the process of enhancing the customer journey and interactions with a business. By personalizing experiences to align with customer needs and preferences, and by improving areas of friction, businesses can enhance customer satisfaction and loyalty.
Dashboard portals can assist businesses in optimizing customer interactions and satisfaction by providing real-time insights into customer behavior, preferences, and trends.
By monitoring customer service performance, tracking customer feedback, and assessing customer satisfaction, dashboard portals can be employed to analyze customer data and pinpoint areas of improvement, enabling businesses to continually optimize the customer experience.
As a result, businesses can build stronger relationships with their customers, increase customer retention, and ultimately drive business growth.
Additionally, companies can monetize their data by offering analytics to their customers at an additional cost. This not only allows your customers to gain actionable insights, it also creates a new revenue stream for your business.

Choosing the Right Dashboard Portal Solution
Choosing the ideal dashboard portal solution for your business may appear challenging, but with appropriate guidance, an informed decision is possible.
To choose the most suitable solution for your business, consider factors such as built-in analytics, visualizations, support, and integration capabilities.
By evaluating each solution based on these factors and determining which one best meets your needs, you can ensure that your dashboard portal will be a valuable asset to your business. Remember, the most appropriate solution for your business is contingent upon your specific needs and requirements.
Evaluating Features
Consider factors like data visualization, customization options, data integration, interactive features, collaboration and sharing, mobile responsiveness, security and access control, and performance and scalability when evaluating dashboard portal features.
Data visualization, which involves creating visual representations of data such as charts, graphs, and maps, is crucial for making data easier to comprehend and analyze.
Customization options for the dashboard portal include:
- Altering the look and feel
- Adding or removing data sources
- Creating custom reports
- Setting up alerts
These options allow you to tailor the dashboard portal to your specific needs. By evaluating these features and considering factors such as data integration, security, and scalability, you can make an informed decision on which dashboard portal solution is best suited for your business.

Dashboard Portal Success Story
For a case study of successful dashboard portal implementation, we'll take a look at Positive Insights Consulting, which partnered with Zuar to build a powerful portal for their clients' analytics.
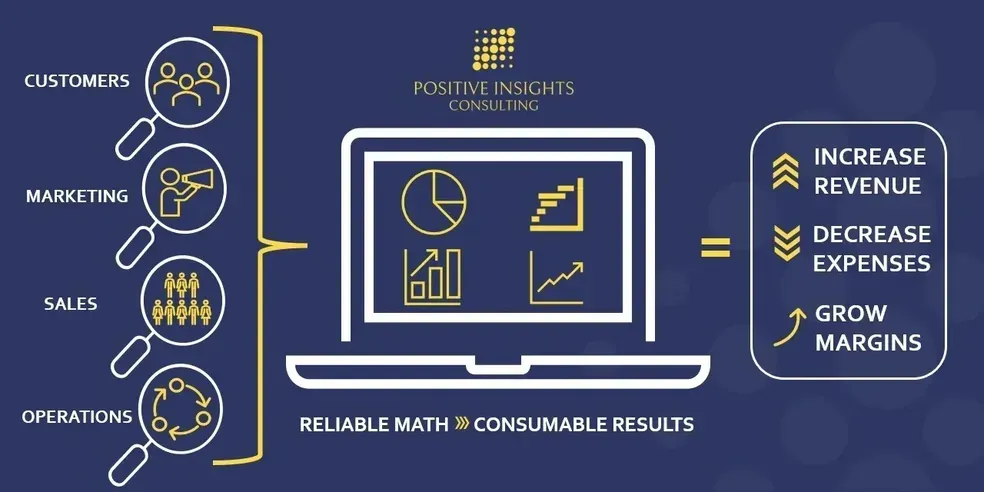
Positive Insights Consulting is a firm that specializes in measuring and forecasting business performance for its clients. Before implementing Zuar's solutions, Positive Insights dedicated a substantial amount of time to compiling data from their client's systems.
Their aim was to decrease the amount of time collecting and preparing data and enhance their client's experience with a custom dashboard portal.
By using Zuar Runner, an automated data pipeline platform, combined with Zuar Portal, a dashboard portal solution, Positive Insights was able to create a branded client dashboard portal that enabled them to personalize which analytics and dashboards can be viewed based on user permissions.
Positive Insights now has a system that automatically pulls data nightly and an industry-leading customer portal with amazing dashboards and reports to impress their clients.
This case study illustrates the power of dashboard portals as well as the importance of optimizing the backend processes to ensure that the data within the portal is up-to-date and accurate.
Learn more about this case study...


Implementing Dashboard Portals
As we've shown, dashboard portals offer businesses a comprehensive solution to visualize and analyze data, fostering collaboration and enhancing customer experiences.
Our team at Zuar has worked with dozens of clients in building and maintaining dashboard portals, providing them with customized, scalable solutions that fit their unique business needs.
We've done this by implementing the Zuar Stack—using Zuar Portal as the front end to display key data visualizations and KPIs and our ELT platform, Zuar Runner, as the backend system, collecting data from potentially hundreds of disparate sources, transforming it into a consistent and usable format, and storing it in a data warehouse.
If you're looking to transform your data analytics and visualization capabilities, we invite you to reach out to us. Let us help you unlock the full potential of your data, streamline your reporting processes, and make data-driven decision-making a reality for your organization.
Schedule some time with one of our data experts for a data strategy assessment to get the ball rolling!
 Team Zuar