Overview
Have you ever wished to share your insightful Power BI reports with a wider audience, yet found yourself struggling with complex embedding processes? Fear not, for Power BI Publish to Web is here to save the day!
With a few simple steps, you can easily embed interactive reports on websites, blogs, and social media platforms.
In this blog post, we will delve into the depths of Power BI Publish, its benefits, step-by-step guide, security considerations, customization, collaboration, and troubleshooting common issues. So, buckle up and get ready to embark on a journey towards seamless report sharing!
Key Takeaways
- Power BI Publish provides a secure platform to share and disseminate data-driven insights with customizable, interactive reports and dashboards.
- Troubleshooting common issues is crucial for a seamless embedding experience.
- Secure alternatives such as file encryption, cloud storage platforms, and data masking solutions can be used for sensitive information sharing.
- Troubleshooting common issues includes implementing placeholder images, configuring Data Gateway, and managing embed codes for enhanced security.
Understanding Power BI Publish
Power BI Publish to web, a part of the Power BI Service, facilitates the sharing of interactive reports and Power BI dashboards across websites, blogs, and social media platforms. This effective tool helps organizations disseminate insights, make data-driven decisions, and relay their narrative to an extensive audience.
With its user-friendly interface and customizable features, Power BI Publish allows you to create visually appealing and engaging reports that can be easily accessed by anyone with the link or embed code.
What is Power BI Publish?
Power BI Publish is a complimentary feature that allows Power BI users to share Power BI content on the web, offering a superior user experience and enabling collaboration, sharing, and management of reports and dashboards. With Power BI premium capacity, users can experience even better performance and scalability.
Embedding interactive reports and visuals from Power BI into your website or application enhances the user experience by providing fully interactive content, which aids informed decision-making based on the available data.
Benefits of Using Power BI Publish
Using Power BI Publish comes with several advantages, such as simple sharing, engaging visuals, and the capacity to reach a broad audience. As a Power BI administrator, you can ensure that only those with the necessary authorization can view the content when accessing the link.
Additionally, Power BI Publish provides a customizable and interactive experience, enabling users to highlight, select, or deselect items in the report to adapt it to their needs.
Key Features of Power BI Publish
Some of the key features of Power BI Publish include:
- Public access: Publish to Web enables users to share content on a publicly accessible website, thus allowing a wider audience to benefit from the shared insights.
- Automatic updates: Published reports and dashboards can be set to automatically update, ensuring that viewers always have access to the latest data.
- Customizable view modes: Users can customize the view modes of their published content, allowing them to control how viewers interact with and explore the data.
- Increased accessibility: Data insights are available directly on your website.
- Enhanced engagement: Data-driven decision-making is accessible to a broader audience.
Additionally, the embedded content offers the following features:
- Automatic updates to ensure the report or visual remains current
- Data caching for an hour upon retrieval
- Customizable view modes to tailor the content to specific needs
These features make the embedded content more engaging and user-friendly.
Power BI Publish to Web Alternative
Another more secure and versatile way to publish Power BI visualizations is by utilizing a data portal solution, such as Zuar Portal.
As will be touched on more later in the article, publishing Power BI to the web makes the data extremely accessible, but that data is not secured in any way.
By using Zuar Portal, you are able to embed Power BI in a website, integrate analytics from other BI platforms (like Tableau), and provide access to all your insights in a secure manner, using authentication and access control. Learn more about Zuar Portal...


Step-by-Step Guide to Publishing Reports with Power BI
The following section offers a detailed guide on creating, deploying, and sharing Power BI reports online through the Publish to Web feature.
From creating your report in Power BI Desktop to embedding the code on your desired platform, we will cover all the essential steps to ensure your published report is accessible, engaging, and up-to-date.
We will start by discussing the basics of the Publish to Web feature, including the types.
Creating Your Report in Power BI Desktop
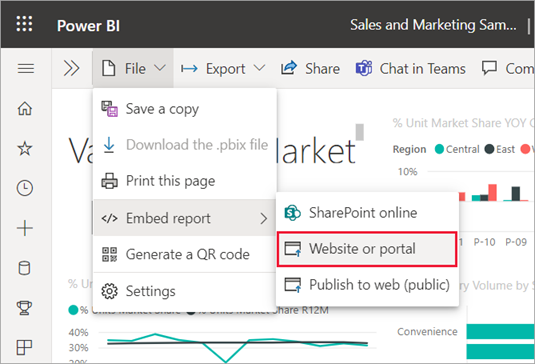
Creating a report in Power BI Desktop requires fulfilling certain requirements and prioritizing visual appeal. To create a report, simply select the 'Publish' button and choose the desired workspace destination.
After making sure your report is visually appealing and contains accurate data, you can proceed to deploy it on Power BI Service, making it accessible online and ready for export data purposes.

Deploying the Report on Power BI Service
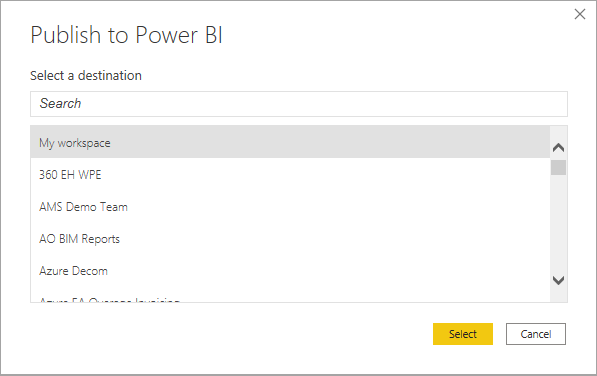
For deploying your report on Power BI Service, follow these steps:
- Choose the workspace destination.
- Press the 'Publish' button in Power BI Desktop.
- Upon completion of the upload, a confirmation message will appear, indicating that your report is now accessible online.
You can then proceed to generate the embed code, which will enable you to share your report on websites, blogs, and social media platforms.
Generating the Embed Code
The process of generating the embed code for your report involves crafting a unique code that facilitates report sharing across different platforms.
Once the embed code is generated, it can be added to an HTML page, blog post, or any other desired location to make your report visible and accessible to the public.
With the embed code in place, your report is now ready to be shared online.
Sharing the Report Online
To share your report online, simply embed the generated code on your desired platform, such as a website, blog, or social media post.
By doing so, you make your report accessible to your target audience, allowing them to interact with the data and gain insights from your analysis.
Keep in mind that the content shared using Power BI Publish to Web is publicly accessible, and you should carefully evaluate the confidentiality of the data and report before sharing it.
Related Article:
 Team Zuar

Security and Privacy Considerations
When using Power BI Publish, it’s vital to consider security and privacy due to the feature’s limitations in these areas.
While it offers a convenient way to share interactive reports with a wide audience, it is crucial to be aware of the potential risks associated with sharing sensitive or confidential data using Publish to Web as data shared using Publish to Web can be accessed by anyone with the link.
Limitations of Publish to Web Security
Publish to Web has limited security features, making it unsuitable for sharing sensitive or confidential data. It is important to note that all report pages are visible when using Power BI Publish to Web, and no measures can be taken to restrict the visibility of certain pages.
Hence, before sharing via Publish to Web, it’s vital to assess the confidentiality of the data and report to safeguard the organization or any individual from potential harm when the content is made public.
Best Practices for Securely Sharing Reports
To ensure secure report sharing, it is recommended to:
- Use encryption for file sharing
- Set access controls for file sharing
- Use secure file transfer protocols
- Train employees on secure practices
- Use secure channels and platforms for transmission and storage
- Address the company’s file-sharing needs head-on
- Select a reliable and secure file-sharing service
- Grant access only to those users who require the file.
By following these best practices, you can mitigate the risks associated with sharing sensitive or confidential data using Power BI Publish to Web.
Alternatives for Sharing Sensitive Data
If you need to share sensitive or confidential data, various secure alternatives are available, such as:
- Utilizing a secure data portal solution like Zuar Portal
- Secure file-sharing tools like Anchor or OneDrive
- Data masking or data secure solutions
- File encryption
- Secure virtual data rooms or PDF encryption methods
Additionally, you can consider other alternatives like Power BI Embedded, Power BI Apps, or controlled access through authentication.
By using these alternatives, you can ensure that your sensitive data is securely shared with the intended audience while minimizing the risks associated with using Publish to Web.

Customizing Your Published Report
Tailoring your published report can boost its look and functionality, leading to a more engaging and user-friendly output.
By adjusting view modes, iFrame dimensions, and managing report pages visibility, you can optimize your report for different devices and screen sizes, as well as tailor its content to meet the needs of your target audience.
Adjusting View Modes and iFrame Dimensions
Optimizing the display of your report on different devices and screen sizes can be achieved by adjusting view modes and iFrame dimensions.
By using CSS to set the width and height properties of the iFrame, you can ensure that your report is displayed correctly across various devices, offering a seamless user experience.
Moreover, the resize property of CSS can be employed to dynamically adjust the iFrame dimensions to accommodate its content, providing a more engaging and visually appealing presentation.

Managing Report Pages Visibility
As all report pages are visible when using Power BI Publish to Web, it is important to carefully manage the visibility of your report pages.
To do so, you can create separate reports for restricted pages or use alternative sharing methods, such as Power BI Embedded or Power BI Apps, which offer greater control over the visibility of report pages.
Keeping Your Report Updated and Refreshed
Ensuring that your report is always up-to-date and refreshed is crucial for providing accurate and timely insights to your audience. By scheduling data refreshes in the Power BI Service and establishing a data refresh schedule, you can guarantee that your report is refreshed with the most recent data on a regular basis.
This will ensure that your users always have access to the latest version of your report, enabling them to make data-driven decisions based on the most current information available.

Leveraging Power BI Workspaces and Apps for Collaboration
Power BI Workspaces and Apps offer a collaborative environment for sharing and managing reports within your organization.
By creating and managing workspaces, sharing reports through Power BI Apps, and controlling access and permissions, you can efficiently collaborate with your team members and ensure that your reports are securely shared and updated.
Power BI Workspaces, including the Power BI workspace, and Apps provide a secure and efficient way to collaborate with your team members, while the Power BI tenant admin ensures the proper management of resources and permissions.
Creating and Managing Workspaces
Creating and managing workspaces in Power BI allows you to:
- Organize your reports and collaborate with your team members
- Easily share your reports and dashboards with specific groups or the entire organization
- Ensure that everyone has access to the latest insights and data.
Additionally, you can manage user permissions and information within the workspace, maintaining control over who can access and edit your reports.
Sharing Reports Through Power BI Apps
Sharing reports through Power BI Apps offers the following benefits:
- Users can access and interact with the data in a secure and controlled environment.
- Reports can be shared with specific groups or the entire organization.
- Customization options are available to tailor the content to the needs of your users.
Controlling Access and Permissions
Controlling access and permissions is essential to ensure that only authorized users can view and edit your reports. By implementing authentication and authorization mechanisms, you can enable individuals to access the necessary information and restrict access to sensitive or confidential data.
Power BI Embedded vs. Publish to Web
Power BI Embedded and Publish to Web offer different levels of security and functionality, making them suitable for different use cases.
The following section compares these two solutions, assisting you in determining the best fit for your needs, considering your security requirements, target audience, and the level of customization you desire.

What is Power BI Embedded?
Power BI Embedded is a feature that allows developers to integrate Power BI’s analytics capabilities into their applications, offering greater control over security and customization.
By embedding interactive reports and visuals into your application, you can provide your users with a secure and fully interactive experience, allowing them to make data-driven decisions within the context of their own applications.
Comparing Security and Functionality
When comparing security and functionality between Power BI Embedded and Publish to Web, Power BI Embedded offers greater security and customization options, while Publish to Web is more accessible but less secure.
Power BI Embedded allows developers to manage who has access to the embedded report and the level of functionality available, whereas Publish to Web is a public-facing solution with limited control over security and functionality.
Choosing the Right Solution for Your Needs
In order to choose the right solution for your needs, it is essential to consider your security requirements, target audience, and desired level of customization.
Power BI Embedded is well-suited for applications that require a high level of security and control over functionality, such as enterprise applications. On the other hand, Publish to Web is better adapted for public-facing applications that require less control over security and functionality, such as customer-facing websites.
While both of these methods offer great benefits and may be sufficient in some instances, we recommend utilizing a more robust solution like Zuar Portal, which allows you to create intuitive, customizable dashboards—pulling data from a variety of BI platforms while providing top-notch security to ensure the privacy of your data.

Troubleshooting Common Issues
The following section offers advice on resolving common problems encountered when using Power BI Publish to Web, including performance impact, data refresh/connectivity issues, and management or deletion of embed codes.
By addressing these issues, you can ensure that your published reports function smoothly and provide accurate, up-to-date insights to your users.
Dealing with Heavy Usage and Performance Impact
Heavy usage and performance impact can be addressed by using placeholder images, limiting queries, and optimizing data refresh schedules. By implementing these measures, you can help alleviate the strain on your system or website, ensuring a seamless user experience and maintaining the performance of your published reports.
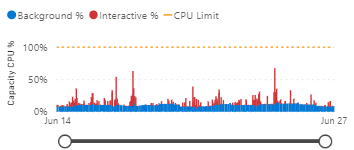
Additionally, monitoring server memory and CPU usage can provide valuable insights into potential bottlenecks or issues, enabling you to take appropriate action to improve performance.
Resolving Data Refresh and Connection Issues
Data refresh and connection issues can be resolved by configuring Data Gateway and ensuring your data sources are properly connected.
By setting up Data Gateway, you can establish a secure connection between your on-premises data sources and the cloud, allowing for timely data refreshes and accurate report updates.
Managing and Deleting Embed Codes
Manage and delete embed codes to revoke access to reports or update the embedded content by navigating to the Admin portal and selecting 'Manage embed codes' to delete or modify the codes.
This not only helps maintain the security and privacy of your data but also allows you to refresh your embedded content with the latest updates and insights.

Enhancing Your BI Reporting
Power BI Publish to Web provides a convenient and efficient way to share interactive reports on websites, blogs, and social media platforms.
While this method is very convenient and works well in certain use cases, it may not be the best method for your organization, depending on the sensitivity of your data, your data sources, the volume of your data, or other factors.
For those looking for a more comprehensive solution, Zuar Portal might just be the tool you need. Learn more about how Zuar Portal can transform your BI reporting by trying out our free demo: