What Is a Performance Dashboard?
Performance dashboards are visual representations of key performance indicators (KPIs) and metrics that provide real-time or near real-time insights into the performance and progress of an organization, team, project, or process.
Decisions would be made based on data insights, not gut feelings, and your business would thrive. This is the power of performance dashboards.
This article will guide you through the world of performance dashboards, from understanding their importance to exploring their components, types, design, and implementation.
Key Takeaways
- Performance dashboards are visual tools that track key metrics and provide real-time insights into operations to enable data-driven decision-making and performance optimization.
- Effective dashboards include KPIs, visual trends for identifying issues, customizable interfaces for different users, and intuitive data visualizations.
- Continual monitoring and improvement of dashboards ensures they remain valuable for achieving strategic goals over time.
Related Article:
 Team Zuar

What Is a Performance Dashboard?
Understanding Performance Dashboards
Business performance dashboards serve as visual tools, assisting businesses in tracking and analyzing key performance indicators (KPIs), thereby enabling data-driven decisions and performance optimization.
They are instrumental in deriving maximum value from data by consolidating diverse information into a singular, customizable interface with interactive features and real-time data extraction.
Implementing a business performance dashboard in your company can lead to increased trust, improved organizational business intelligence, and ultimately, better business performance.
In the contemporary data-driven landscape, an intuitive user interface (UI/UX) in a performance dashboard is indispensable for businesses across all scales and sectors.
From sales performance dashboards that track revenue and customer acquisition to employee performance dashboards that monitor individual productivity, the possibilities are endless.
With the right dashboard designs and data visualization tools, you can transform raw data into actionable insights that drive your business forward.
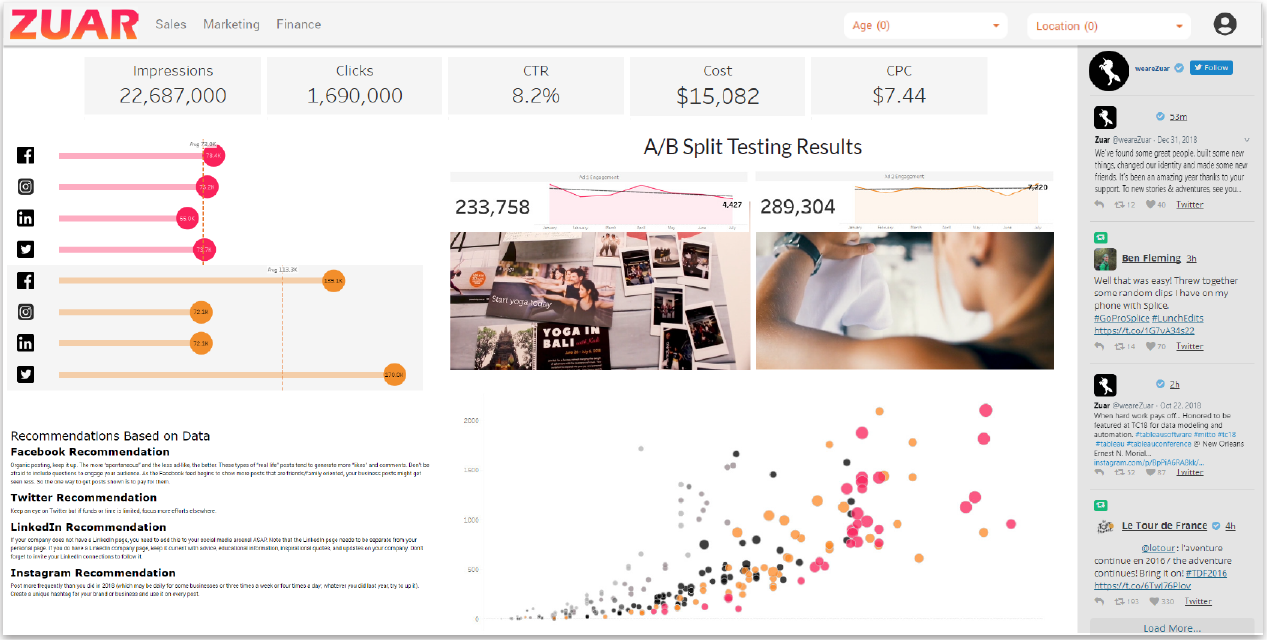
Additionally, by using a data portal solution, such as Zuar Portal, you can provide all users with secure access to critical business metrics and insights in one centralized destination. Here's an example of a performance dashboard through Zuar Portal:

Components of an Effective Performance Dashboard
An effective performance dashboard should include five key components:
- Measurable KPIs
- Trends
- Customization
- Data Visualization
Each of these components plays a crucial role in providing a comprehensive view of your business performance, helping you make informed decisions and optimize your processes.
We’ll delve further into each component to comprehend their importance.
Measurable KPIs
Key Performance Indicators (KPIs) are metrics used to measure progress and identify areas for improvement in a performance dashboard, for example, tracking operational costs and other financial metrics.
For a KPI to be effective, it should be easily measurable, pertinent to the associated objectives, and accessible in a timely fashion. For example, an accounting department might focus on KPIs like gross profit margin, financial leverage, and total seasonality to monitor their financial performance.
Establishing clear and measurable KPIs ensures your performance dashboard accurately mirrors your business’s progress towards its objectives.
This allows you to quickly identify areas for improvement, allocate resources more efficiently, and make better decisions based on real-time data.
Trends
Trends refer to patterns or shifts in behavior, preferences, or attitudes that can be observed over a period of time. In the context of performance dashboards, trends help businesses identify patterns and potential issues, allowing for proactive decision-making.
Integrating trend metrics into your performance dashboard allows for proactive identification of potential issues and report generation.
For example, suppose your sales performance dashboard reveals a sudden decrease in sales from a specific region. By examining the trends, you might discover that a competitor has recently entered the market, or there has been a change in customer preferences.
With this knowledge, you can take proactive steps to address the issue, such as launching targeted marketing campaigns or adapting your product offerings to better suit the needs of the customers in that region.
Customization
Customization refers to the process of modifying or adapting something to suit individual preferences or specific requirements. In the context of performance dashboards, customization enables different teams or departments to view different data or alter its format in accordance with their role’s objectives.
Utilizing a customizable interface in a performance dashboard benefits the user by enabling access to real-time data from a wide array of sources.
For instance, your marketing team may be more interested in tracking the performance of their campaigns, while your finance department may focus on monitoring revenue and expenses.
By customizing your performance dashboard to display relevant data for each team, you can ensure that every department has access to the information they need to make informed decisions and contribute to the overall success of your business.
Data Visualization
Data visualization makes data more engaging and comprehensible. Through the incorporation of pertinent imagery and colors, it is possible to emphasize key performance indicators or personalize the dashboard for each individual.
For example, using pie charts to represent the percentage breakdown of sales by product category or bar charts to compare the performance of different marketing campaigns can help users quickly grasp the information and make better decisions.
Presenting data in a visually engaging and comprehensible format ensures your performance dashboard continues to be an invaluable tool for propelling business growth.

Types of Performance Dashboards
Performance dashboards can be tailored to various business functions, such as sales, marketing, finance, and employee performance.
This versatility allows you to create dashboards that are specifically designed to meet the unique needs and goals of each department within your organization.
Some popular types of performance dashboards include:
Strategic Dashboards: These dashboards provide high-level insights into overall business performance, such as revenue, market share, and profitability. They are used by executives and senior management for strategic decision-making, long-term planning, and performance monitoring.
Operational Dashboards: These dashboards focus on operational metrics, such as production rates, efficiency, and quality control. They are used by managers and supervisors to monitor day-to-day operations, identify performance issues, and make informed decisions.
Financial Dashboards: These dashboards provide insights into financial performance metrics, such as revenue, expenses, and cash flow. They are used by finance teams and executives to monitor financial health, forecast future trends, and identify areas for improvement.
Sales Dashboards: These dashboards track sales performance metrics, such as revenue, conversion rates, and customer acquisition. They are used by sales teams and managers to monitor sales progress, identify trends, and optimize sales performance.
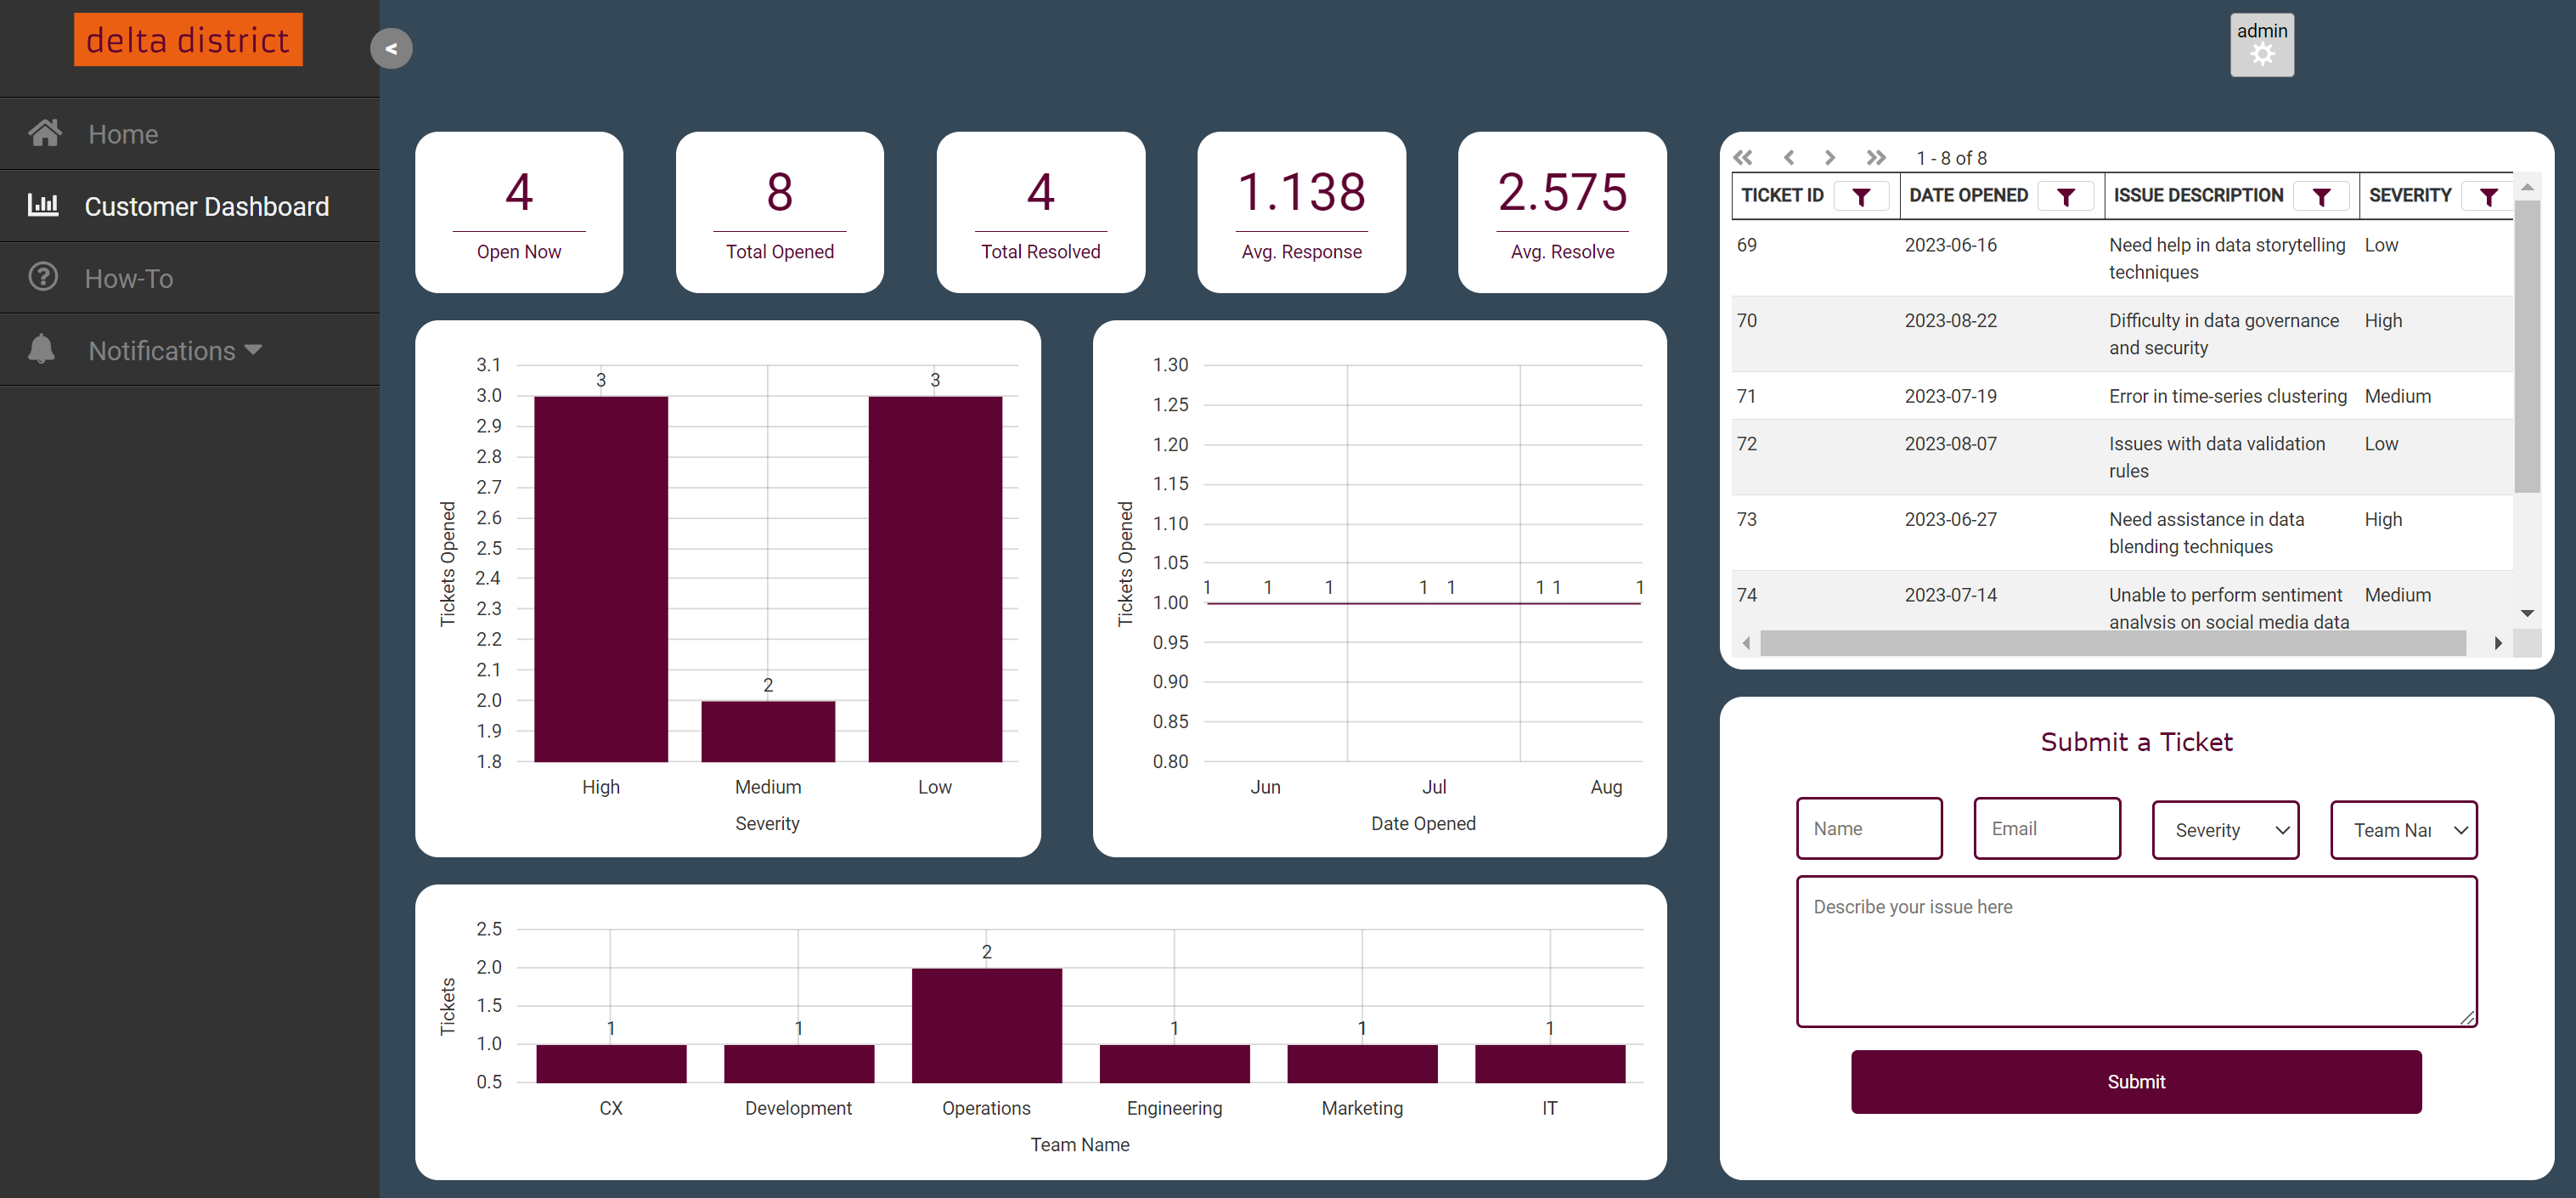
Customer Dashboards: These dashboards track customer-related metrics, such as customer satisfaction, retention, and feedback. They are used by customer service teams and executives to monitor customer interactions, improve customer experiences, and drive customer loyalty.
Marketing Dashboards: These dashboards focus on marketing performance metrics, such as lead generation, website traffic, and campaign outcomes. They are used by marketing teams and managers to monitor marketing effectiveness, track the success of campaigns, and make data-driven marketing decisions.
Choosing the most appropriate performance dashboards for your business enables access to the most pertinent and actionable data for your specific needs.

Designing Your Performance Dashboard
Designing a performance dashboard involves several key steps, including selecting relevant metrics, creating an attractive layout, and incorporating interactive elements.
To begin, you must identify the essential metrics that align with your specific needs and goals. Once you have chosen the most pertinent KPIs, you can select data sources that will provide the necessary information for measuring these KPIs.
Next, focus on creating an engaging and visually appealing layout that effectively presents the data. This may involve grouping data logically, making efficient use of space, and choosing the most appropriate visuals to represent the data.
Ensuring the dashboard is optimized for mobile devices is also extremely beneficial. The ability to access mobile dashboards boosts analytics usage and enables stakeholders to access performance dashboards wherever and whenever they need to.
Finally, incorporate interactive elements, such as drill-downs and filters, to enable users to quickly locate and analyze the information they need.
By following these steps, you can design a performance dashboard that not only meets your specific requirements but also provides a user-friendly and engaging experience for your team.
Watch this video to learn how to design performance dashboards geared for executives:

Implementing Performance Dashboards in Your Business
Upon designing your performance dashboard, the next step is its implementation within your business. This involves selecting the right tools and platforms to support your dashboard, training employees to use the dashboard effectively, and integrating the dashboard into your daily workflows.
Some popular tools and platforms for creating and managing performance dashboards include Tableau and Power BI. Both of these platforms can connect to Zuar Portal to guarantee secure analytics access for all your stakeholders.
Providing training and support for your employees is also essential to ensure full utilization of the dashboard and its features. This may involve creating user guides, conducting workshops, or offering one-on-one training sessions.
By investing in employee training, you can ensure that your team is equipped with the skills and knowledge necessary to make the most of your performance dashboard, ultimately leading to improved business performance and success.

Monitoring and Improving Your Performance Dashboard
Regularly monitoring and improving your performance dashboards is vital to maintain their effectiveness and alignment with your business objectives. This involves keeping track of your dashboard's performance, collecting user feedback, and making adjustments as needed.
Enforcing governance rules to guarantee data accuracy and consistency is an additional vital step.
By monitoring your dashboard’s performance, you can identify any issues or areas for improvement and make the necessary adjustments. This may involve updating your KPIs, refining your data sources, or modifying the dashboard’s layout and visuals.
Continual improvement of your performance dashboard guarantees it remains a valuable tool for propelling your business and achieving strategic goals.

Performance Dashboard Examples
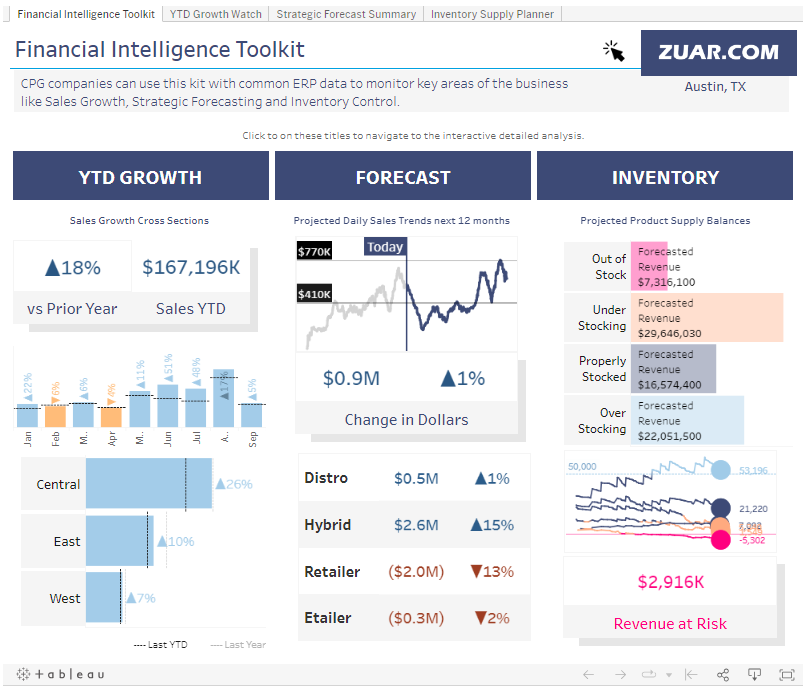
Looking at real-life examples of performance dashboards can provide inspiration and insights into best practices for dashboard design and implementation. For instance, a Profit & Loss Dashboard might include financial metrics such as:
- Gross profit margin
- Opex ratio
- Operating margin percentage
- Net profit margin percentage
This type of dashboard provides businesses with the ability to gain insight into the trends and factors driving profit and loss, enabling key decision-makers to make informed financial projections and maintain fiscal balance for long-term growth and financial health.
Another example is the Sales & Order Overview Dashboard, which includes KPIs like:
- Order return reasons
- Perfect order rates
- Overall order number
- Best-sellers
- Regional sales
By examining these performance metrics, businesses can identify areas for improvement in their sales processes and optimize their business operations to drive better results.
By learning from these real-life examples, you can gain valuable insights into creating a performance dashboard that effectively serves your business’s needs.

Benefits of Performance Dashboards
Performance dashboards offer businesses real-time visibility into key metrics, enabling informed decision-making and strategic planning.
By consolidating data from multiple sources and presenting it in a visually appealing format, these dashboards provide a comprehensive overview of performance indicators.
They allow stakeholders to monitor progress, identify trends, and make data-driven decisions. With quick access to relevant information, executives and managers can respond promptly to challenges and optimize operations.
Performance dashboards also promote transparency and collaboration, fostering a data-driven culture where employees can align their efforts, track progress, and contribute to organizational goals.
Overall, performance dashboards empower organizations to drive performance improvements, enhance productivity, and stay ahead in a competitive landscape.

Tips for Optimizing Performance Dashboards
Maximizing the benefits of performance dashboards requires focusing on a few key strategies. First, concentrate on pertinent KPIs that align with your business goals and objectives. This ensures that your dashboard accurately reflects your business’s progress and allows you to quickly identify areas for improvement.
Next, encourage collaboration among your team members by sharing the dashboard with relevant stakeholders and fostering a culture of continuous improvement. This allows your team to work together more effectively, identify potential issues, and make data-driven decisions.
Additionally, embedding performance dashboards in a website or application can be highly beneficial as it provides stakeholders with real-time access to critical data and key performance metrics in a familiar online environment.
Finally, leverage predictive analytics to make more accurate forecasts and enhance your business’s performance. By following these tips, you can maximize the benefits of your performance dashboard and drive your business towards success.

Performance Dashboards Next Steps
Performance dashboards are powerful tools that help businesses track and analyze key performance indicators to make informed decisions and optimize overall performance.
However, having well-designed performance dashboards is useless if employees are not actually using them. Providing your users with easy access to your enterprise-wide analytics is crucial to ensure analytics usage.
That's where Zuar Portal comes in. This embedded analytics solution allows you to provide secure, global access to all your organization’s analytics. Zuar Portal is the easy way to create unique analytics hubs for executives, employees, partners, vendors, customers, and more.
Click here to check out the demo of Zuar Portal. To start a two-week free trial to explore more advanced features, such as admin mode, click here.
On top of that, our experienced team of data experts will guide you through the entire digital transformation process, from data strategy formulation, to implementation, to long-term support.
Get the ball rolling by scheduling a data strategy assessment with one of our experts!