Tableau Server Hardware Performance Tuning
See a customer use case showing how to measure and maximize the performance of your Tableau Server investment.

Tableau Performance: The Background
One of our larger customers purchased an on-premise Tableau Server, hosting Tableau views fed from a hundred on-site manufacturing plants. The server manages and visualizes local plant-level manufacturing data, in addition to an executive corporate-level suite of dashboards hosted in a Zuar Portal. This is accomplished with an automated Zuar Runner ELT data pipeline. These solutions working together, we like to call "The Z Stack”.
In this real-world customer use case, the solution stack also hosts row-level security and data write-back capability. Individual sites can both see and dynamically update and view site-level data as changes are made. In creating this solution, there were many considerations at play. For this discussion, we’ll walk through some of the steps made to optimize the Tableau Server performance for this solution.
Tableau Server Configuration
When optimizing the configuration of Tableau Server, two primary process considerations consume CPU cycles, namely Backgrounder and VizQL Server. To scale Tableau Server, increase the number of these processes installed depending on the Server's workload composition. CPU is an expensive resource and not unlimited, however. Backgrounder processes - responsible completing scheduled tasks, e.g. extract refreshes - are especially CPU intensive when running and you should carefully consider any topology change.
For this reason, it is common to isolate the Backgrounder processes on separate server nodes to ensure that VizQL is not adversely starved, affecting rendering performance and user interaction experience. This separation also allows for increasing VizQL processes and resources to influence performance directly. If you are new to Tableau Server processes, check out the overview of each Tableau Server process or the Scalability Whitepaper for a more in-depth discussion of process interplay.
Due to the row-level security and included live update capability, the design does not include extracts, so in our case, isolation of Tableau Server Backgrounders is not a consideration for the server configuration strategy. This application is also not positioned as a mission-critical component, so a multi-node High Availability (HA) design with cluster failover is unnecessary. For reference, if you are curious about other scenarios, check out the Tableau Performance Tuning overview of Tableau Server Performance considerations and scenario configurations.
The Tableau Server was configured in a two-node set up with a 16 core license and all licensed processes hosted on the second node when this project began. The request was to ensure that the Tableau server was performing as well as possible to support the overall solution and optimize the investment. With this environment and background in place, we made the changes to optimize this configuration and maximize performance.
 Team Zuar
Cluster configuration was changed to simplify to a single node configuration. As mentioned, backgrounders are not at play significantly, so VizQL is free to consume available CPU resources. The single-node also removes the possibility of any node to node cluster latency due to network traffic with nodes hosted on separate hardware.
A note: When working in a virtual environment, CPU cores are not the same as vCPUs, which is discussed in the "Note:" on Tableau Recommended Baseline Configuration page. The best way that I have found to see how many CPU cores Tableau is 'seeing' to enter the following on the command line (Windows) since this is an Azure article:
"WMIC CPU Get NumberOfCores,NumberOfLogicalProcessors /Format:List"
This simple command can streamline dialogs with IT departments to ensure that everyone is talking about the same numbers rather than worrying about what vCPU or hyper-threading mean. Use the "Number of Cores" value for any Tableau Server sizing conversation. This number is also the number Tableau uses for computing core licensing.
Our CPU and RAM setup is the default for a 16 core Tableau Server, which is calculated as 8 GB per CPU core to arrive at 128 GB RAM.
For disk space requirements, the baseline Tableau configurations are listed at 50 GB for OS with additional space to hold extracts and repository data based on environment size. Interestingly absent from this page is a mention of disk type and speed from the recommendation given the impact we will show has on server performance.

Tableau Performance: Tuning and Testing
By default, Tableau Server contains pre-built administrator performance-related views when logged into the server as an Admin under the 'Server Status' section. These views allow for looking at things like the 'Performance of Views,' a workbook-related metric, or 'Stats for Space Usage' on the hardware performance side as outlined here.
Related:

The Admin Views are contained in Tableau workbooks which live in temporary files on Tableau Server. The name and location depends on your version of Tableau Server. The workbooks can be customized and then published back to your Tableau Server for continued monitoring and investigation into Tableau Server performance.
Making your own version of the admin views can be helpful if you don't have access to the admin views in your organization and are responsible for Server Performance or would like to modify these views for your unique purpose.
On Windows, one can use Windows Performance Monitor (PerfMon) to understand server hardware characteristics. The setup of PerfMon is outlined by Tableau here and can be used with the sample workbook provided on the Tableau website here. Also, here is a review of Performance Monitor counters used to measure the performance of virtual Windows environments.
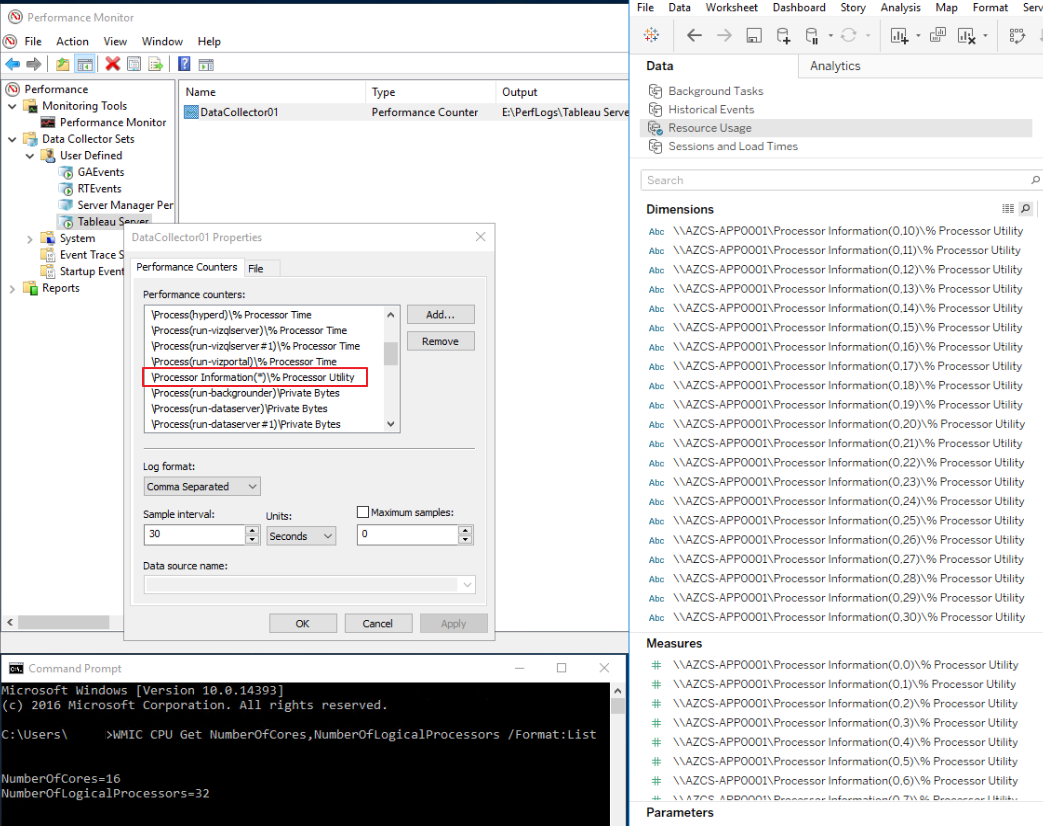
Using these links as a starting point, I add a few tips that can make the setup easier. Configuring individual counters in Performance Monitor is tedious as each item has to be carefully selected from the list. Consider creating a 'User Defined Template", export the template to XML, Open the XML and add the following sections for <Counter> and corresponding <CounterDisplayName>, then reimport. This will save the time required to select each item individually. Note that Tableau Server process-related items will likely need to be modified to match the number of processes for your particular Server configuration. Instructions for working with Windows Performance Monitor Templates are here, and here is the XML portion of the template for copy-paste and time savings.
Windows Performance Monitor Template XML
2. Selection of wildcard "*" related Performance Counters will provide all members of that category even if new items are added. In this case notice that "Processor Information(*)\%Processor Utility" so that if/when additional cores are added to the server they appeared in the output file for Tableau to read, following the refreshing of the extracted data source.
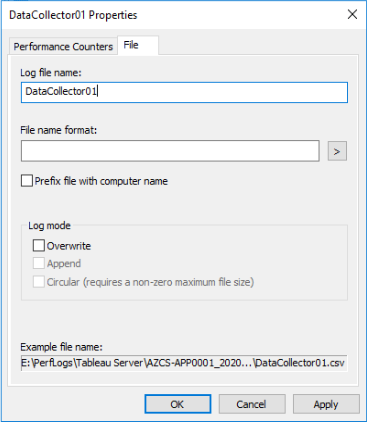
3. Ensure that the 'Overwrite' option is not selected in Properties to have a new log file written out each time the counter is restarted (usually after modification). I suggest writing out all files then using the wildcard union capability in Tableau to view all unioned csv log files.
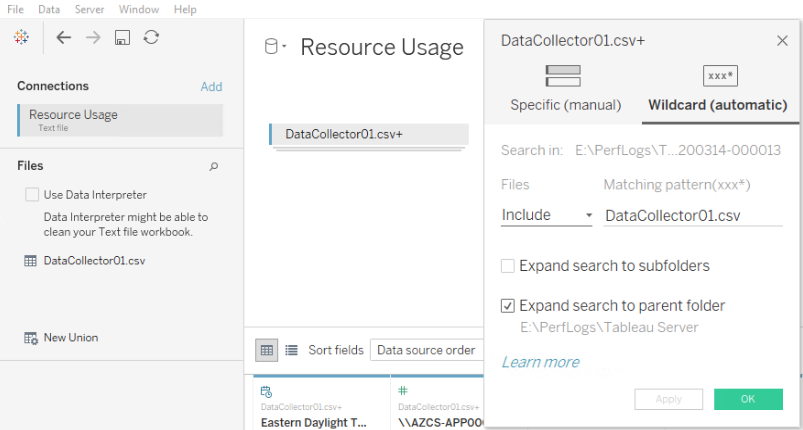
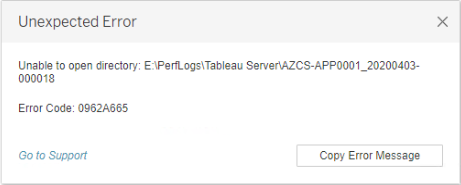
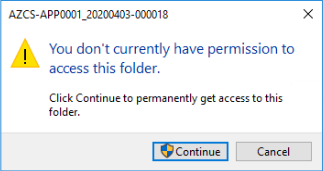
4. When accessing the CSV files from Tableau, it is possible to receive a cryptic error that looks like the following when the data source is refreshed. In my case, the fix for this was to ensure that the logged-in user had access to the output directory by manually opening the folder. This situation can happen if the logged-in user is different from the authorized user as defined in PerfMon.
5. If you use the template workbook provided by Tableau, the Dimension values will have to be updated (using Replace References) to point to the values in your logging file. The Dimensions have the format \\<Machine Name>\<Log Value> so the <Machine Name> portion of the Dimension name must be updated with your machine name. (pictured above in the screenshot for #2)
6. By default, these entries show up in Tableau as String "Abc" Dimensions; however, they should be converted to Measures with a default format of data type "Number (decimal)" (pictured above in the screenshot for #2).

How to Know if You Need Tableau Performance Tuning
CPU by Process
When looking at CPU performance for a Tableau server environment, the key is to manage server CPU utilization spikes appropriately. Here is a look at maximum CPU utilization per hour by the VM (top) with a stacked view showing max CPU utilization by Tableau Process. As a benchmark, utilization above 80% is dangerous.
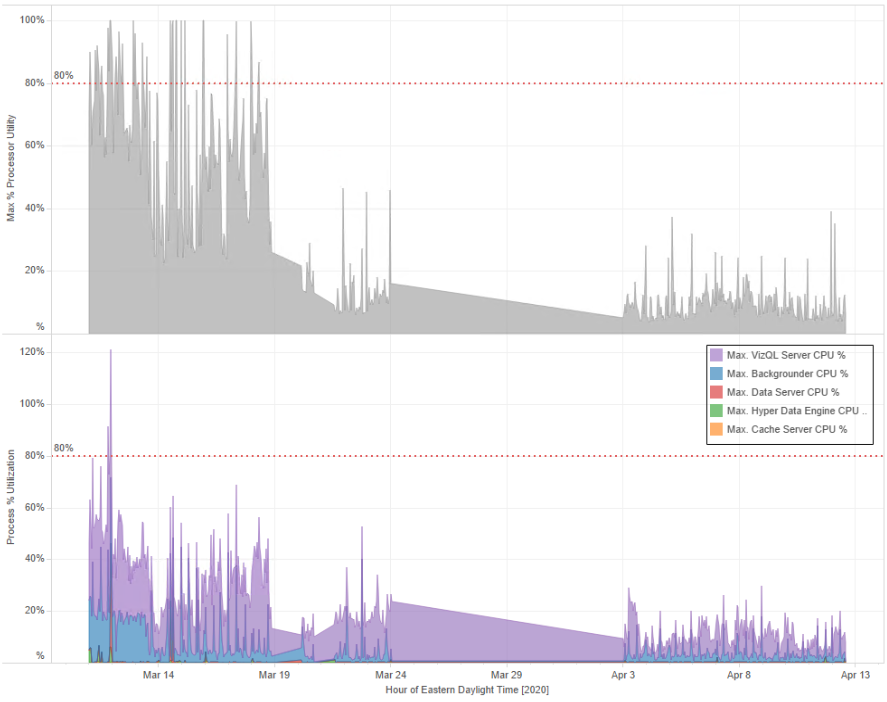
Broken out by individual process here is what this looks like. Note here that the axis scales are intentionally not the same so that the smaller processes are visible.
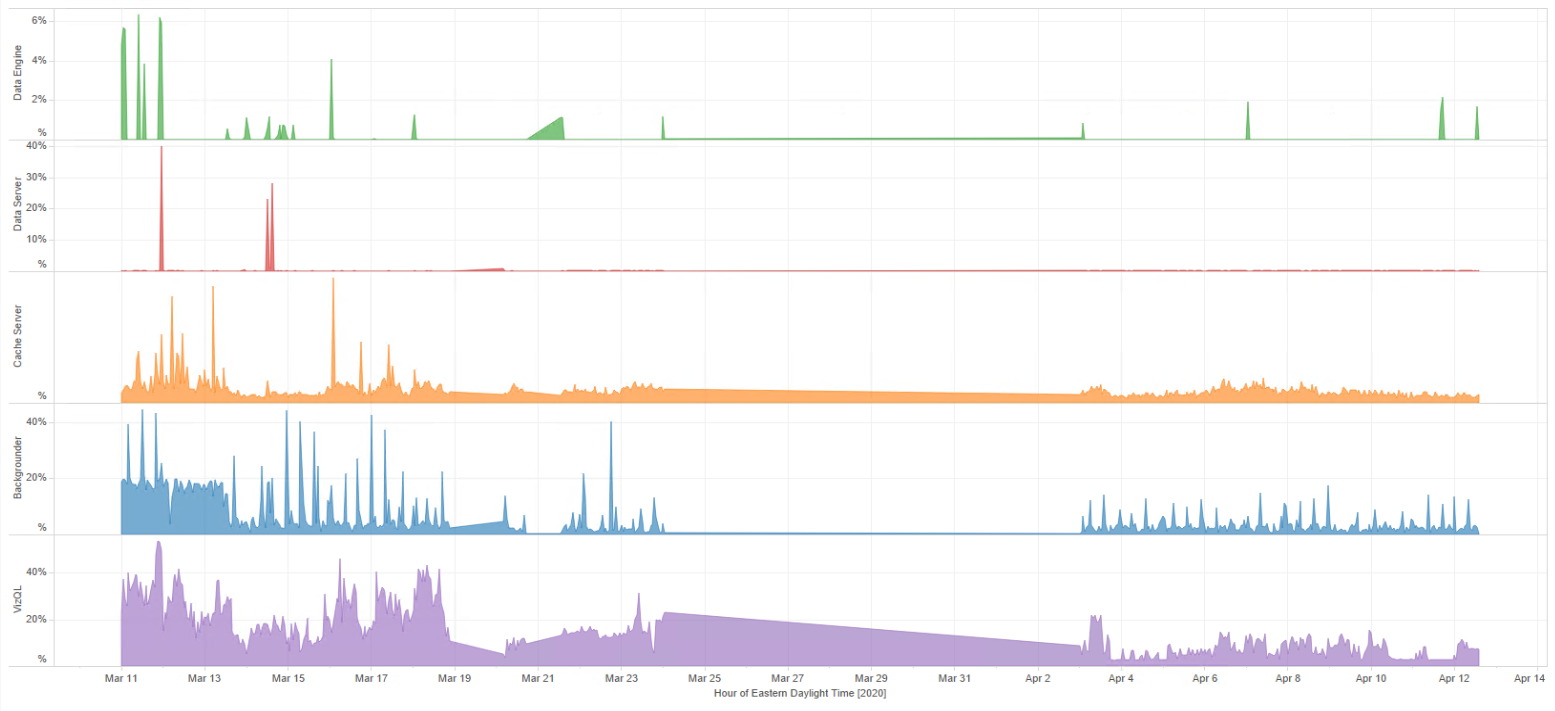
The views show that VizQL (Purple) is the major consumer with minimal Backgrounder (Blue) processes occasionally spiking for nonessential maintenance workbooks, scheduled to refresh during non-peak times. Some management and cleanup were applied here to reduce Backgrounder utilization.
Also, the view starts with 8 CPU cores and ends with 16 cores, which explains the reduction in % utilization across the view. While a good improvement, in our scenario, we started with 16 CPU cores (not shown in the view), so even though more CPU headroom exists, perceived net end-user performance was about the same. So this is not the droid we are looking for, and we continue looking.
Disk Queue
This view is showing Disk Queue on C drive only, where Tableau was initially installed. Disk Queue is the number of processes that are waiting in queue for access to the disk for read/write operations. Any queue above 2 (above the red reference line added to the base workbook) is considered high and not performant.
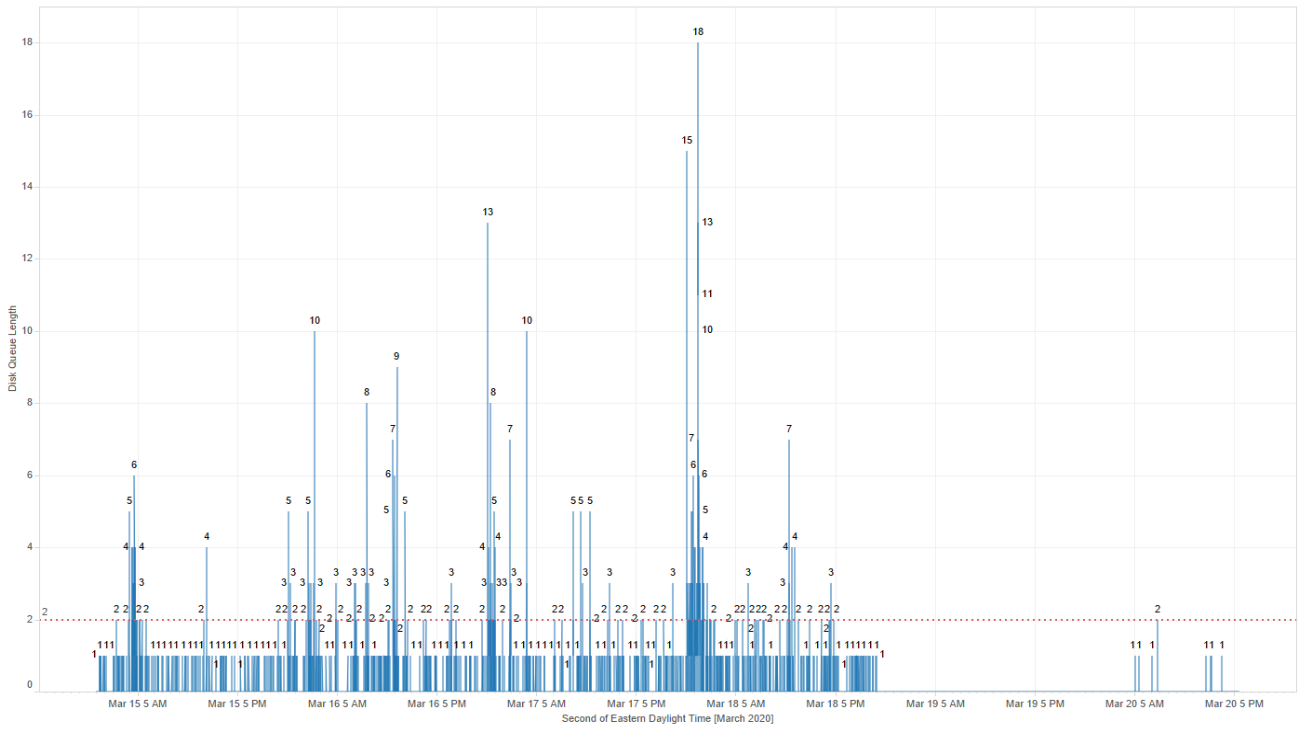
Two observations are visible here in that Disk Queue view with Tableau Server installed on the C drive. The C: drive is not keeping up with disk read/write operations which can cause the OS to hang momentarily, which also affects Tableau Server performance.
Installing Tableau Server in the Cloud - AWS and Azure
As of the writing of this article, Tableau Server Requirements mention disk size, cores, and RAM for Minimum Production Requirements with links to configuration documents the following Virtual Machine (VM) Whitepapers. Reading further into these sources reveals that disk speed is also a significant performance consideration with recommendations provided. Concerning disk type, listed here are the sections of interest from the Whitepapers for both Azure and AWS environments with additional links for VM and storage pricing:
Whitepaper: Next Generation Cloud BI: Tableau Server hosted on Microsoft Azure
"D16s_v3 provides the equivalent of 8 CPUs (16 vCPUs), 64 GiB memory and 128 GiB SSD storage. If you are looking to trial Tableau Server or want a baseline hardware recommendation to use for testing your usage patterns this is a great size to start with."
"For production installations it is recommended to install Tableau Server on a separate drive of type Premium SSD disk type of at least 128 GB (P10 size)"
Azure Managed disks options are: Ultra, Premium, Standard SSD, and Standard Hard Disk Drives (HDD)
Azure Virtual Machine Selection
Whitepaper: Tableau Server on Amazon Web Services - Deployment Guidelines and Best Practices
"Typically, you should choose an instance type and size in accordance with the minimum recommendations (8 cores and 64GiB memory) for deploying Tableau Server on Amazon EC2. Currently, EC2 instances like the m4.4xlarge and r4.4xlarge meet our criteria for RAM and CPU. Either is a good starting point for deployment."
"Amazon Elastic Block Store (Amazon EBS) delivers persistent block-level storage volumes for use with EC2 instances in the AWS cloud. We recommend deploying your EC2 instance with at least two volumes: • A 30 – 50 GiB volume for the operating system • A 100 GiB+ volume for Tableau Server You should leverage Amazon EBS General Purpose SSD (GP2) volumes. Over the long term, we have generally experienced below-average-to-poor performance using magnetic disks and therefore recommend you avoid them."
Selecting an AWS Instance Type and Size
Also worth mention here are AWS specifications from Tableau and associated article discussing optimal server hardware for AWS.
Disk
Two changes were made to drive setup:
1. In Tableau Server we talk about distributing expensive processes across a cluster and in this context separation of Tableau Server from the OS drive is the same principle. A reinstall of Tableau Server onto a second G:\ drive was performed to remove the single OS hosted drive disk queue contention.
2. Change the drive type to an SSD class drive for better performance to keep up with disk queue.
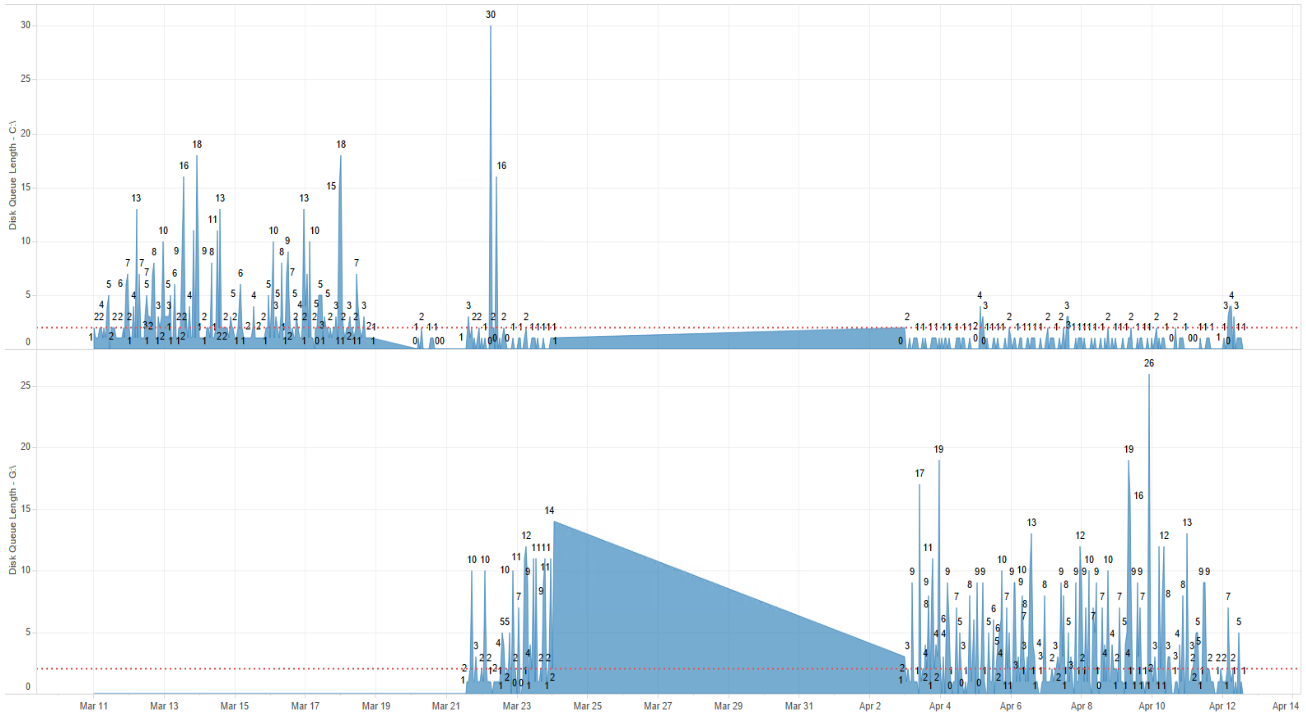
This view shows some initial set up spikes on C:\ however it then stabilizes on the OS partition C:\ with the load going to G:\ the Tableau Server drive.
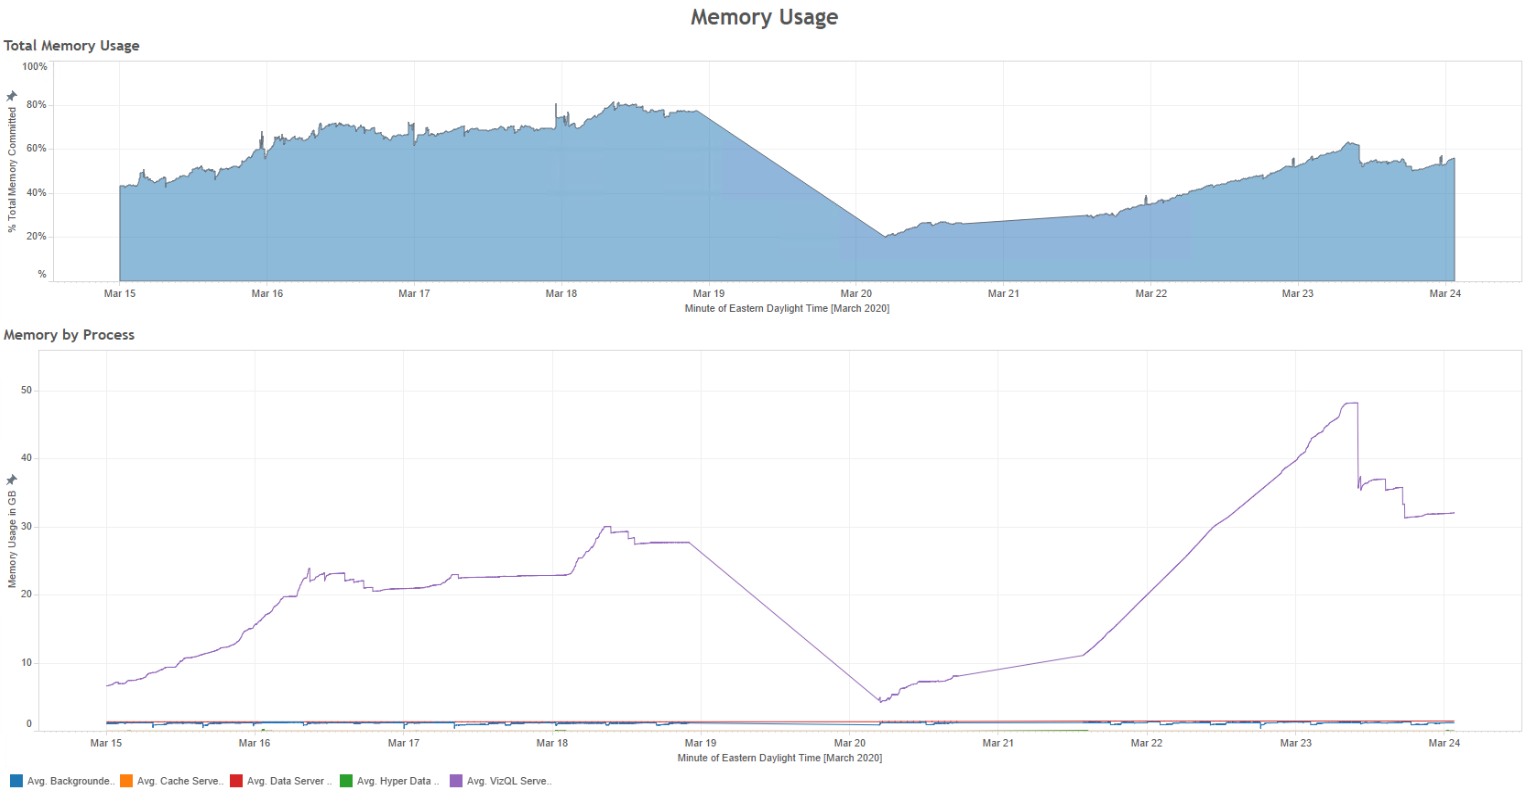
RAM
With the increase in CPU Cores we also doubled the RAM on the node to 8 x 16 (Cores) = 128GB. The utilization wasn't bad previous, however with the increased core number we also doubled the number of VizQL processes which results in additional RAM utilization. Here the increased utilization is visible, but appears lower as percentage on the top graph because the amount of total RAM available was increased.

Conclusion
Even though this article lists changes to CPU, RAM, and Disk, our environment began and ended with the same CPU cores (we are working with a core license) and about the same amount of RAM.
The only difference here is the consolidation of a second node to simplify the architecture; in the future, we may move to a three-node cluster once this becomes a more mission-critical solution. With this consideration, the change producing the largest end user impact was the disk type and configuration.
This change allowed the server to function more responsively both when working on the server remotely via VPN & RDP and a significant end user performance improvement when viewing tableau dashboards, causing our customer advocate to write:
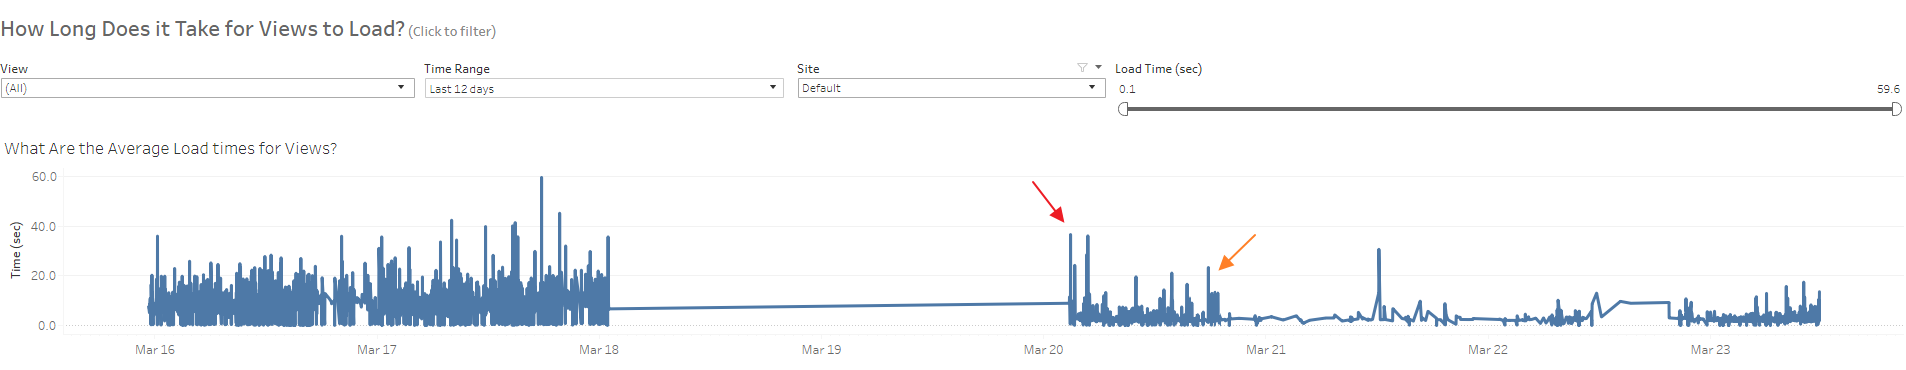
"It would appear that between the fixes applied to the server and new resources the view load times have been cut in half. Looking at the Traffic to Views, it appears we have about the same traffic today as a week ago."
The performance change is visible on Nov 20 (red arrow), where we adjusted our server drive type to premium SSD and OS/Tableau drive configuration. A second improvement (orange arrow) was also visible when the original 16 core configuration was restored with eight additional cores to the base eight-core configuration.
The journey to arrive at clear strategies like this that improve Tableau performance requires the coordinated effort of multiple disciplines, applied knowledge, and experience. At Zuar, our tableau-certified consultants regularly assist customers with Tableau installation, Windows and Linux upgrades, admin best practice training, and server performance optimization exercises. Learn how Zuar's services optimize the value of your Tableau investment.
Take advantage of everything Zuar offers to companies using Tableau!
- Zuar Portals are an easy way to provide branded Tableau dashboards. Monetize your data or provide secure access outside of corporate firewalls.
- Transport, warehouse, transform, model, report & monitor. Zuar Runner gets data flowing from hundreds of potential sources into a single destination for Tableau.
- Read our other articles Tableau-focused articles, such as...

 Greg Rossi