Lately I’ve been building a lot of Tableau client overview dashboards, and keep happening upon a similar use case used to display most recent month, day, or year data using this Tableau date calculation.
In this post I will show you a calculation to display the aggregation of up to date data (by month) that will automatically update over time and is safe to use with actions and filters.
{MAX(DATETRUNC('month',[Last Logged In]))} = (DATETRUNC('month',[Last Logged In]))
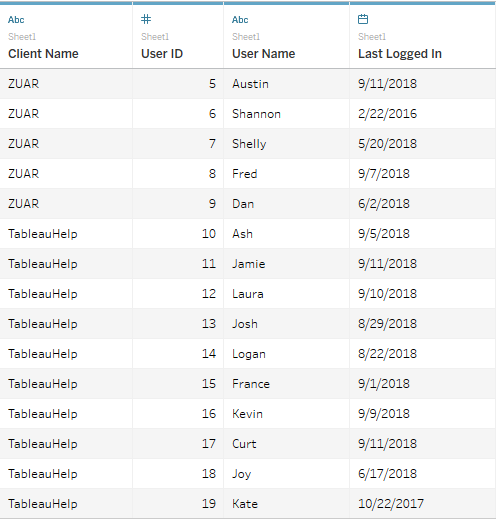
- The structure of my table: Client Name (Company), User ID, User Name, Last Logged In (Timestamp for every login)
- Structurally, I want to create a new column that has only the most recent month so that I can then compare each Last Logged In date to that column. If Last Logged In date equals the most recent month, then True.
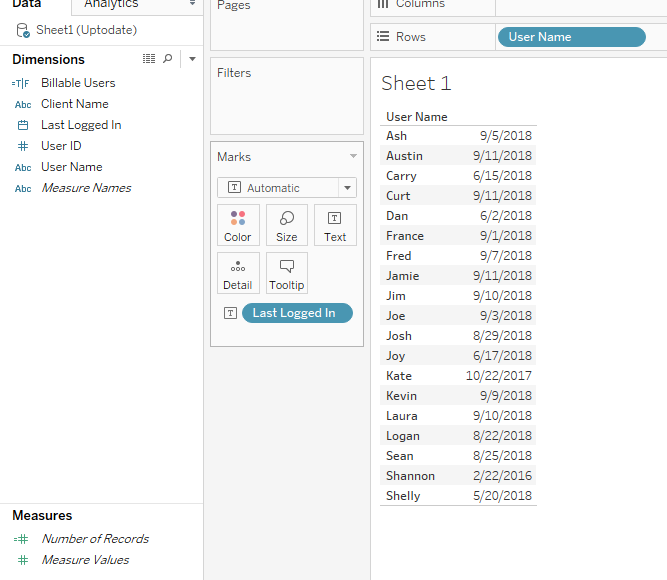
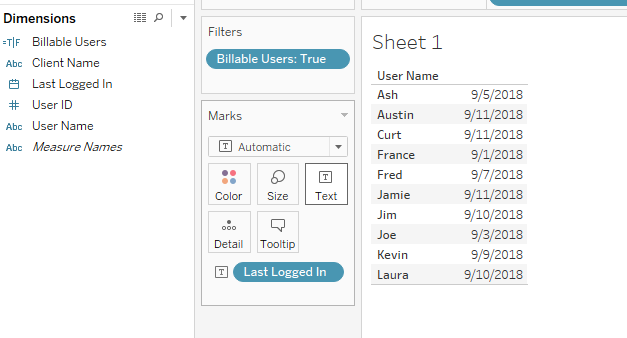
- I will drag User Name to rows then right click and drag Last Logged In to Text Mark (Select Last Logged In Discrete from the drop field pop up) your view should look something like….
- Next, drag Last Logged In pill to filters shelf, select Month/Year from the pop up menu, check September 2018. Now you should see all users that logged in this month… Note: If you stop here, the date will not automatically updated every month and you’re visualization will break when using other dashboards actions or filters.
- Now let's write the Calculation and compare our results to the above filter
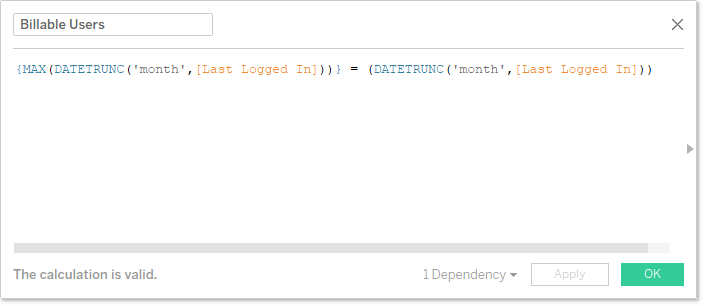
{MAX(DATETRUNC('month',[Last Logged In]))} = (DATETRUNC('month',[Last Logged In]))
{MAX(DATETRUNC('month',[Last Logged In]))}: This will create the column for the max 'month' date in the data set, which is September (at the time of this post).
= (DATETRUNC('month',[Last Logged In])) : This will compare the Last Logged In date to the created column. I'm going to call this calc "Billable Users"
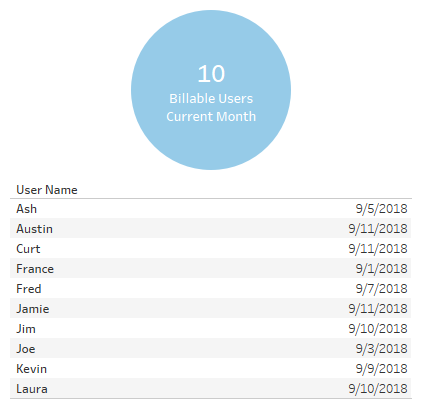
- Next, drag that calculation to the Filters Shelf and select True. And, there you have it!
- I'm now free to aggregate this, make it look nice, place it on a dashboard. It will be dynamic and respond to actions and filters without breaking.
Take advantage of everything Zuar offers to companies using Tableau!
- Zuar Portal is an easy way to provide branded Tableau dashboards. Monetize your data or provide secure access outside of corporate firewalls.
- Transport, warehouse, transform, model, report & monitor. Zuar Runner gets data flowing from hundreds of potential sources into a single destination for Tableau.
- Zuar's team of Tableau-certified consultants can take the headaches out of even the most complex projects.