Imagine a world where your business decisions are backed by data-driven insights, enabling you to optimize performance, minimize risks and maximize profits. That world is here thanks to Business Intelligence (BI) reporting.
This comprehensive guide will walk you through the ins and outs of BI reporting, essential features, best practices, and future trends that will revolutionize the way businesses operate.
Are you ready to harness the power of BI reporting and propel your organization to new heights?

Key Takeaways
- BI reporting is a crucial tool for organizations to make informed decisions and optimize business performance.
- Essential features of modern BI tools include self-service capabilities, data visualization, business intelligence dashboard creation, integration with multiple data sources, and robust security measures.
- The future of BI reporting presents innovative data trends such as AI-powered analytics, mobile access and advanced analytics techniques to gain even more insights.

Understanding BI Reporting: Definition & Importance
The process of BI reporting involves gathering, evaluating, and displaying data, which aids in business performance optimization.
With its various components and crucial role in data-driven decision-making, BI reporting has become an indispensable tool for organizations aiming to derive actionable insights from their current and historical data.
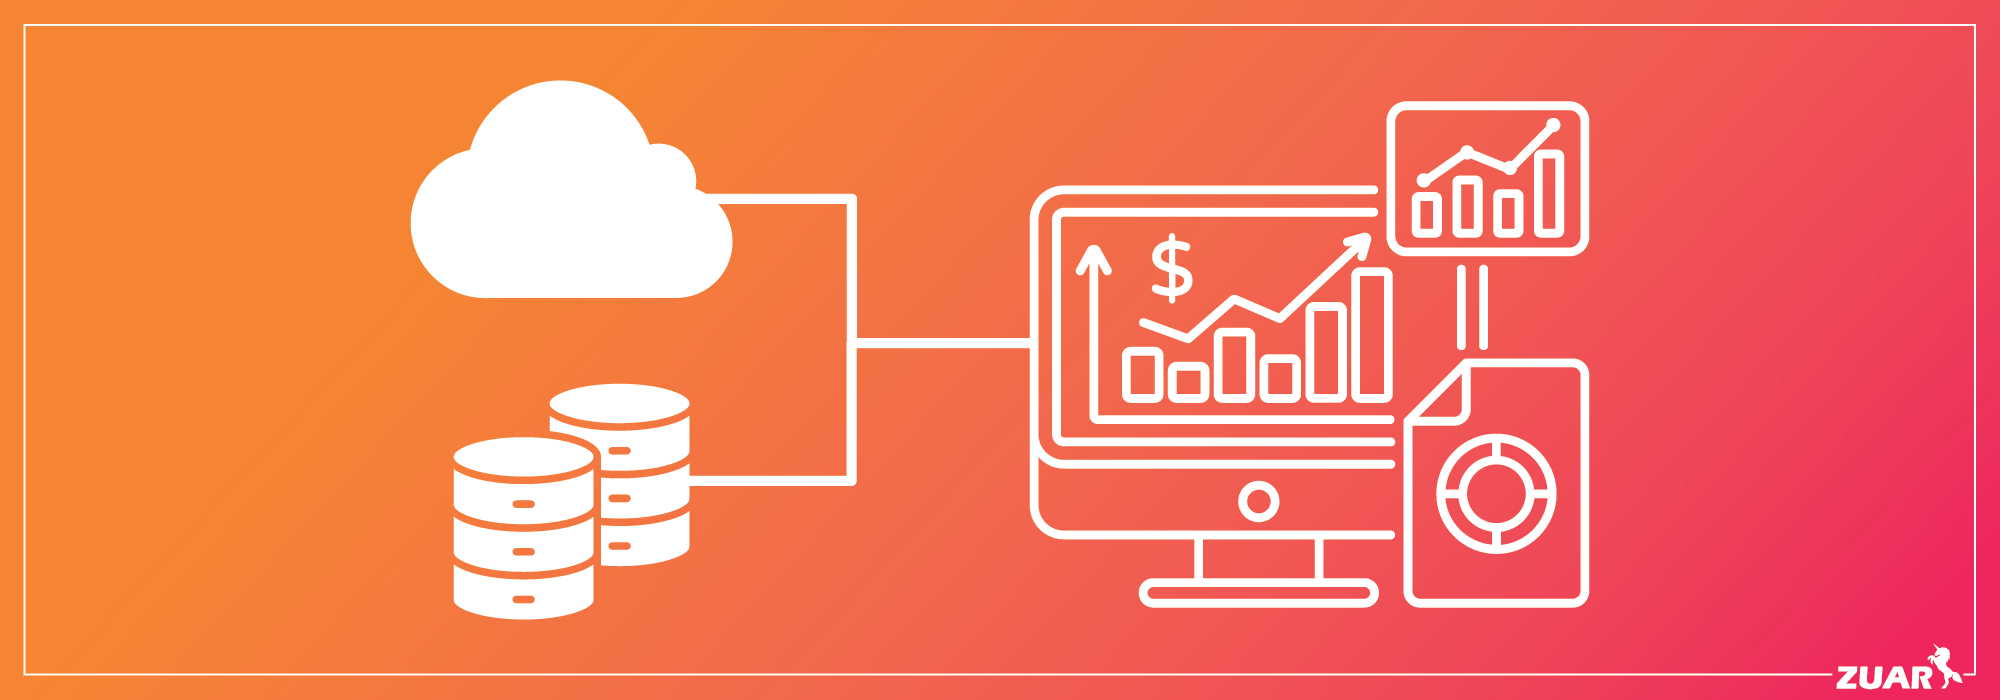
If you're looking to consolidate your BI reporting to a single, easy-to-use location for important analytics, look no further than Zuar Portal. Zuar Portal is the easy way to create unique analytics hubs for executives, employees, partners, vendors, customers and more. Employ drag-and-drop simplicity to build your analytics HQ. Zuar Portal works with multiple business intelligence platforms and data sources. Learn more here:

Components of BI Reporting
BI reporting involves various components such as:
- Data Sources: Refers to where the raw data is collected. Examples of data sources are databases (such as MySQL, Microsoft SQL Server, Snowflake, etc.), spreadsheets, and APIs.
- Measurements: These include KPIs (key performance indicators), financial metrics, customer satisfaction metrics, and more.
- Dimensions: These help to organize and categorize data for analysis and reporting purposes. Dimensions are attributes or characteristics that provide context and structure to the data.
All of these components are used to generate tables, charts, and dashboards. Consolidating all your data through BI reporting offers a comprehensive view of the business.
The Role of BI Reporting in Data-Driven Decision Making
Data-driven decision-making heavily relies on BI reporting. BI reporting tools assist organizations in making informed decisions by offering:
- Valuable insights
- Personalized business intelligence reports
- Eliminating data silos
Interactive data visualizations further enhance the understanding and analysis of the data, making decision-making a breeze.

Essential Features of Modern BI Reporting Tools
Modern BI reporting tools have evolved to include a plethora of features that cater to the diverse needs of organizations. These essential features include:
- Self-service capabilities
- Data visualization and dashboard creation
- Integration with a variety of data sources
- Robust security measures
Incorporating such features empowers businesses to fully leverage their data using modern BI tools.
Self-Service Capabilities
Self-service BI reporting tools enable users to independently access and analyze data without the need for IT or data expertise, giving them the freedom to explore data and derive insights at their convenience.
Such an approach enhances agility and data accuracy, accelerating the decision-making process.
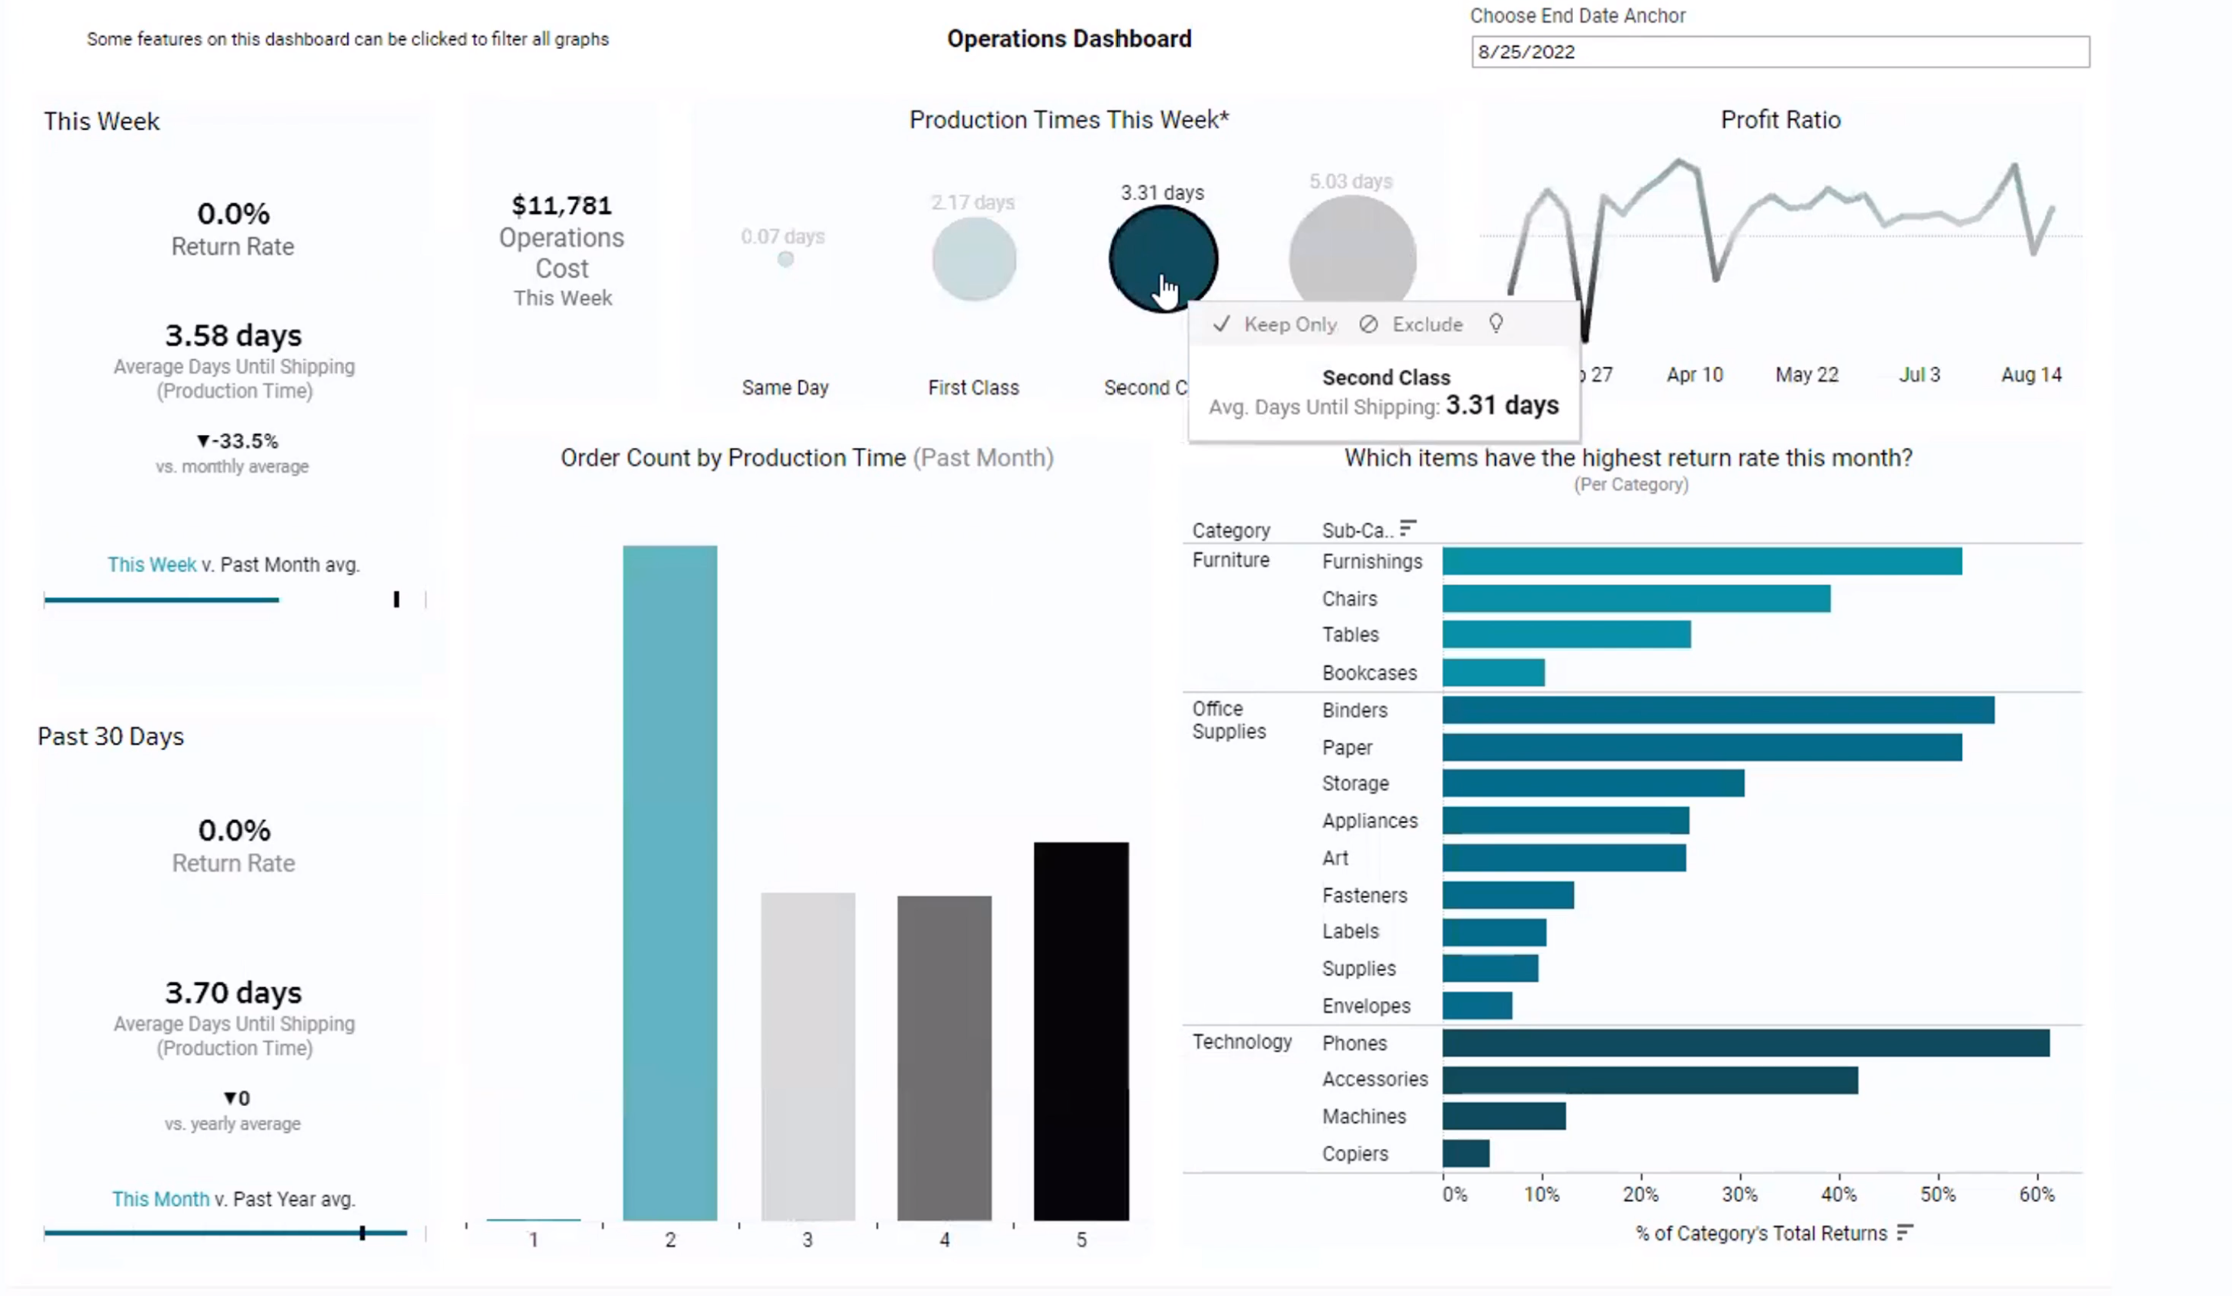
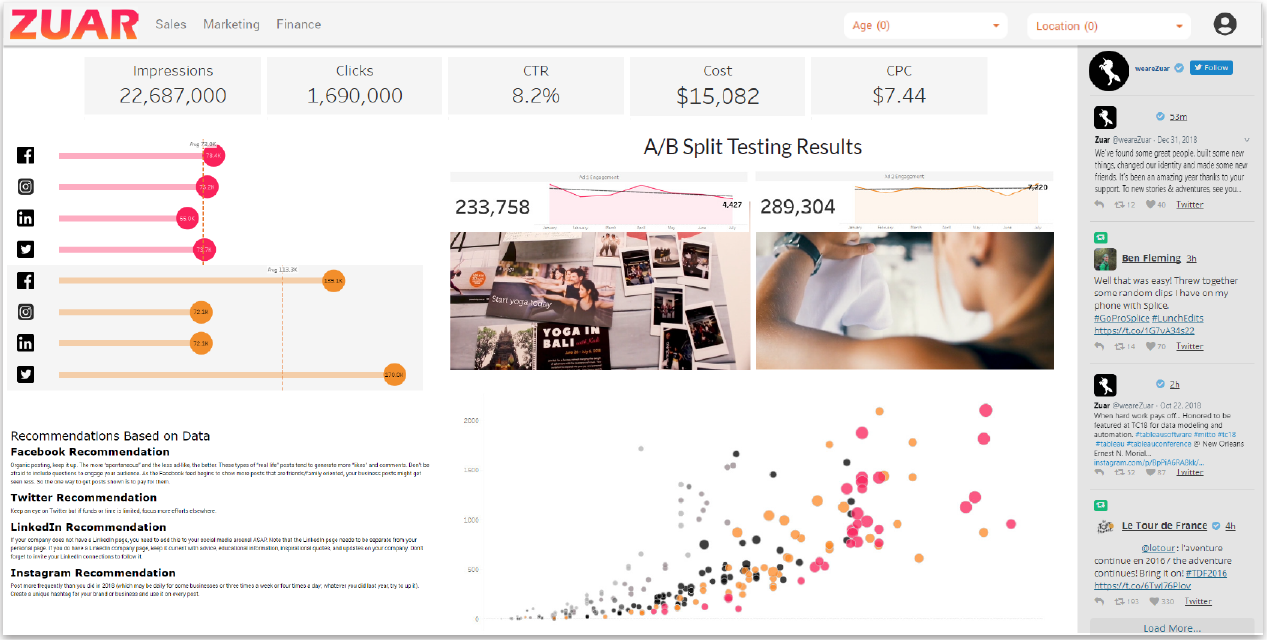
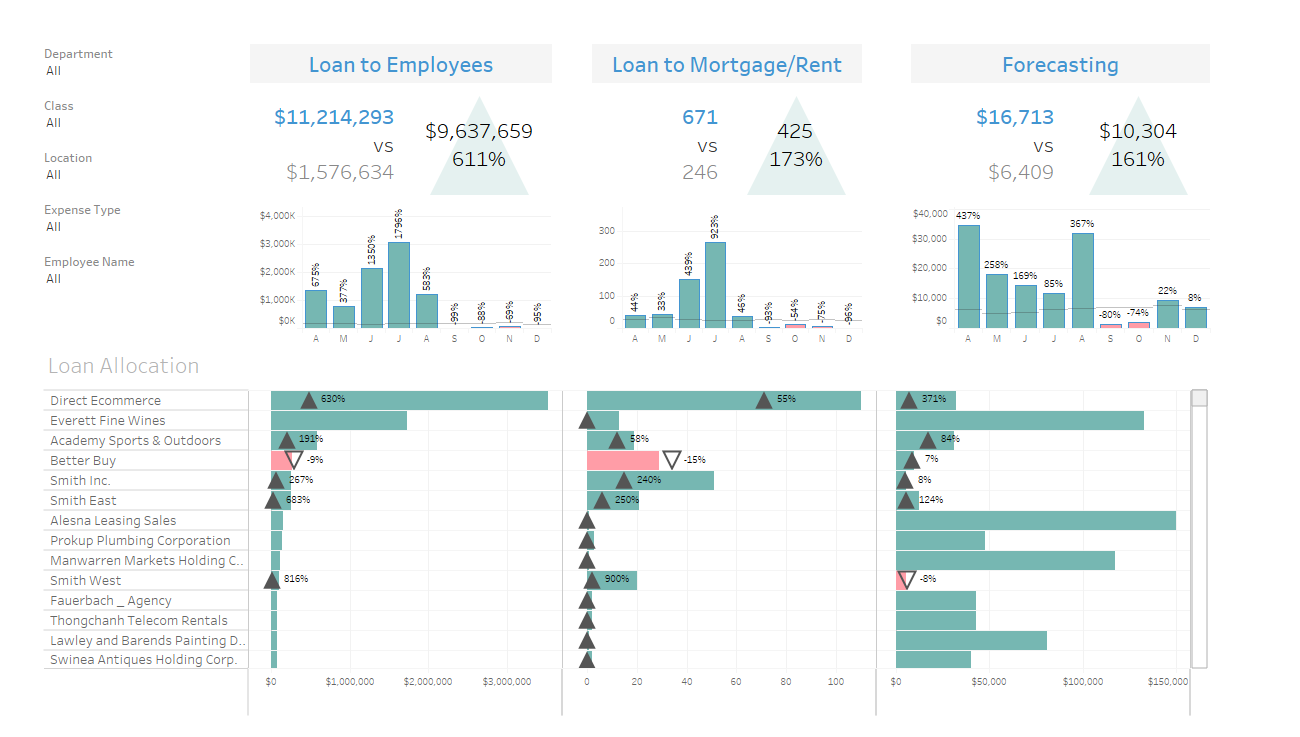
Data Visualization & Dashboard Creation
Data visualization and dashboard creation in BI reporting enable users to gain insights from complex data and more easily identify hidden trends and patterns.
Presenting data in an appealing visual format like charts, graphs, and maps allows users to understand and analyze information easily, thereby increasing analytics usage and comprehension.
Learn more about creating effective dashboards:
Integration With Multiple Data Sources
Integration with multiple data sources, including databases, spreadsheets, and cloud-based applications, is pivotal for modern BI tools to ensure comprehensive and accurate reporting from a reliable data source.
Automating the flow of data from multiple sources eliminates manual processes, freeing up employees' time and allowing organizations to derive meaningful data insights from a broad range of sources.
Security Measures
In today’s data-driven world, protecting sensitive data and preventing unauthorized access is of utmost importance.
Contemporary BI reporting tools incorporate robust security measures, including user authentication, data encryption, and access control to safeguard sensitive information and maintain user trust.

Best Practices for Effective BI Reporting
To unlock the full potential of BI reporting, it is essential to follow best practices that ensure the accuracy and reliability of the data being used.
These best practices include choosing the right metrics, ensuring data quality, and fostering a data-driven culture in the organization.
Your business can reap the numerous benefits of BI reporting by implementing practices to create reports effectively.
Choosing the Right Metrics
Selecting relevant KPIs and metrics is crucial in ensuring that BI reports provide valuable insights for decision-making.
Focusing on the metrics most relevant to your organization can lead to report generation that drives significant change and aligns with your business objectives.
Ensuring Data Quality
Accurate and reliable BI reporting hinges on ensuring data quality. Poor data can result in incorrect reports and wrong decisions, ultimately leading to distrust in your organization's analytics.
Data validation, data cleansing, and data governance are vital processes that help guarantee the accuracy and dependability of the data used in BI reports.
Implementing Automation
Automation can be utilized in BI reporting to streamline and enhance the reporting process. Automated reports involve using tools and technologies to gather, transform, analyze, and present data without manual intervention (often using ETL/ELT processes).
Automation reduces human errors, accelerates report generation, ensures consistency, and allows stakeholders to access up-to-date insights in a timely manner.
Fostering a Data-Driven Culture
Creating a data-driven culture within your organization encourages the use of BI reporting and promotes the usage of actionable insights across all levels of the company.
Empowering employees with the necessary tools and resources to embrace data-driven decision-making allows your organization to leverage BI reporting to gain a competitive advantage.

BI Reporting Examples Across Industries
BI reporting is invaluable across various industries to gain performance insights and make informed decisions for growth and success.
 Team Zuar
Finance Industry
In the finance industry, BI reporting is utilized for risk management, fraud detection and financial analysis. BI tools help financial organizations optimize their strategies and make better-informed decisions by providing insights into customer behavior, sales performance and financial trends.
Healthcare Industry
The healthcare industry leverages BI reporting for optimizing patient care, allocating resources, and ensuring regulatory compliance.
From analyzing workflow and operations to identifying trends in electronic health records (EHRs), BI reporting tools enable healthcare organizations to improve patient outcomes and streamline their processes.
BI reporting, supported by enterprise business intelligence platforms, can help healthcare organizations better serve their patients by identifying areas of improvement and performing efficient data analysis through a well-designed BI reporting process.
Retail Industry
The retail industry utilizes BI reporting for sales performance, inventory management and customer analysis.
BI reporting tools help retailers optimize their strategies, increase customer satisfaction, and ultimately boost profits by providing insights into consumer behavior, product performance, and supply chain efficiency,

Overcoming Common BI Reporting Challenges
BI reporting, while powerful, can present challenges that organizations must address to fully harness its potential. Common challenges include data integration, data management, user adoption, user training, scalability and performance. Overcoming these challenges can help businesses unlock their BI reporting tools’ full potential and drive success.
Data Integration & Management
Data integration and management can be complex, and different systems do not natively integrate with one another. However, modern third-party BI tools can simplify the process by providing automated data integration capabilities and user-friendly interfaces.
Additionally, organizations can guarantee successful data integration and management by implementing best practices for data quality, using suitable metrics, and fostering a data-driven culture.
User Adoption & Training
User adoption and training are essential for maximizing the benefits of BI reporting tools.
Providing clear and concise training materials, hands-on training sessions, and ongoing support and guidance can facilitate user adoption and ensure users are familiar with the tools and can use them effectively.
Investing in user adoption and training can enable organizations to ensure effective utilization of their BI reporting tools.
Scalability & Performance
Scalability and performance are crucial for ensuring that BI reporting tools can handle growing data volumes and user demands.
Strategies like utilizing cloud-based solutions, leveraging automation, and optimizing data architecture can help tackle scalability and performance challenges.

The Future of BI Reporting: Trends & Innovations
The future of BI reporting is full of exciting trends and innovations that will further revolutionize the way businesses operate. These advancements include AI-powered BI reporting, mobile BI/remote access, and the integration of advanced analytics techniques.
AI-Powered BI Reporting
AI-powered BI reporting can automate data analysis and provide predictive insights, detecting patterns and trends in data that may be difficult to uncover otherwise.
Artificial intelligence technologies in business intelligence reporting tools can streamline the report generation process and uncover valuable insights, thereby saving time and effort for organizations.
Mobile BI & Remote Access
Mobile BI and remote access enable users to:
- Access BI reports from any device, promoting real-time decision-making
- Access data and insights from any location and at any time
- Cut costs related to travel and other expenses for accessing data from distant locations
This can be particularly beneficial for organizations with multiple offices or remote workers, as it allows their employees to work from anywhere.
Integrating Advanced Analytics Techniques
The integration of advanced analytics techniques, such as machine learning and data mining, can enhance the capabilities of BI reporting tools.
Incorporating sophisticated data analytics techniques can enable organizations to gain profound insights and make more accurate predictions, resulting in improved decision-making and superior customer service.

Level-Up Your BI Reporting
If you're looking to take your BI reporting to the next level, Zuar is here to help. Zuar is the analytics headquarters for organizations of all sizes.
- Use Zuar Runner to automate the flow of data from hundreds of potential sources into a single destination for analytics, fully prepped and ready for analysis/visualization by platforms like Tableau and Power BI.
- With Zuar Portal, provide customized, secure, global analytics and dashboard access to any audience. It's a powerful platform with unrivaled flexibility.
Our team of data experts is standing by to help guide you along your BI reporting journey. Schedule a data strategy assessment today to get the ball rolling!
Frequently Asked Questions
What is BI reporting?
Business intelligence reporting, commonly referred to as BI reporting, is the use of analytics software to collect, organize and present data for consumption, analysis and decision-making.
Is Tableau a BI reporting tool?
Yes, Tableau is a BI reporting tool, as it offers users the ability to perform data analysis, data manipulation, and data visualization for the collection, integration, analysis, and presentation of business information.
What is the role of data visualization & dashboard creation in BI reporting?
Data visualization and dashboard creation are essential tools in BI reporting, allowing users to gain insights into complex data quickly and easily for more informed decision-making.
Dashboards provide a visual representation of data, making it easier to identify trends and patterns. They can also be used to compare different data sets, allowing users to draw conclusions and make decisions based on the data.
How can modern BI tools simplify data integration & management?
Modern BI tools make data integration and management simpler and more efficient by providing automated data integration capabilities and user-friendly interfaces for data visualization.
These tools allow users to quickly and easily access, analyze and visualize data from multiple sources, enabling them to make informed decisions and take action quickly. They also provide powerful analytics capabilities, allowing users to uncover insights and trends.
Team Zuar