Amazon has become a world-renowned platform for buying and selling quality goods. A good deal of their success has to do with how they have helped enable third-party entrepreneurs to sell their products through Amazon’s Seller Central. Since 2000, selling on Amazon has allowed individuals and businesses to significantly increase their sales while enabling them to reach new customers. Now, more than half of all Amazon’s total unit sales come from these third-party selections. But there’s more to the process than just listing your products for people to buy, especially if you’re a seller who owns and operates an official brand.
By enrolling in Amazon’s Brand Registry, brand owners gain access to a wide range of tools that have been specially designed to assist them in protecting and building their brand while forming better relationships with their customers. Some of these tools include A+ content to help showcase a brand’s story, sponsored ads featuring the brand logo and custom headlines, and up to three of your top products, report violations, and accurate listings tools, and much more. One of the essential tools that brand owners should know about is Amazon Brand Analytics.
Brand Analytics is a free tool that allows sellers with their own brands to access a range of insightful data, which can be used to make more informed and strategic decisions to improve their store’s performance. Brand analytics also enables sellers to learn more about their customer’s search terms and behavior through comprehensive analytic reports, providing them with the ability to make more effective business decisions regarding their product portfolio, marketing, and advertising activities.
Brand Analytics Reports
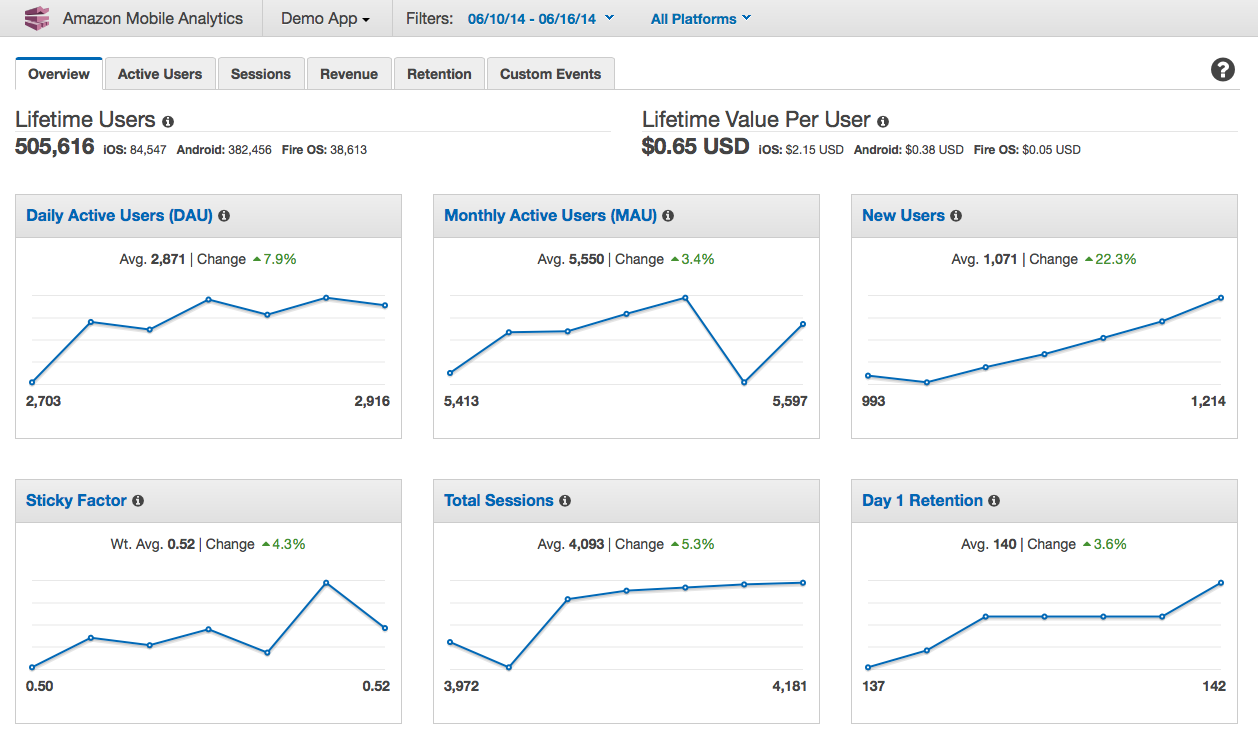
The options for Brand Analytics can be easily found under the ‘Reports’ tab in Amazon Seller Central. The six graphs above provide brand owners with a range of valuable data and information, such as forecasting and inventory planning, pre-orders, traffic/sales diagnostics, and customer behavior. Generally, sellers can access their Brand Analytics data within 72 hours of the close of a given period.
Amazon Search Terms Report
The Amazon Search Terms Report provides brand owners with aggregate information regarding how customers find their products (and competitor’s products) in the Amazon store. The report indicates the most popular search terms used in the Amazon store within a specific timeframe, a frequency rank for each term, and the top three products selected after searching for those terms.
Information is also given regarding the click share and conversion share of those three products. Brand owners can use this report to keep track of whether any of their products have been included in, or dropped from, the top three ASINs for a particular search term. The information is provided in a table that is reevaluated and updated weekly.
Item Comparison Report
The Item Comparison Report shows brand owners the top five products that Amazon customers viewed most frequently on the same day as the brand owner’s products, allowing brands to monitor the performance of competing products on the market directly. The report also displays the percentage that each competing product was viewed on the same day compared to the brand owner’s products.
Demographics Report
The Demographics Report shows brand owners a detailed breakdown of their Amazon customers by gender, age, education, household income, and marital status. This data allows them to better assess the wants and needs of their target markets. It provides metrics on the number of unique customers, total ordered product sales, and ordered units for each demographic segment.
Alternate Purchase Report
The Alternate Purchase Report shows the top five competing products that aggregate customers most frequently bought on the same day they were viewed, rather than products offered by the brand owner. This provides brand owners with information and analysis on competing product differentiation and portfolio mix opportunities. Additionally, this report also provides the percentage of the time that each of those top five products was a competing product to those offered by the brand owner.
Market Basket Report
The Market Basket Report shows brand owners the top three products that aggregate customers most commonly purchased when also purchasing the brand owner’s products. This information can allow brand owners to identify potential bundling and cross-marketing opportunities that they can use to promote more successful sales for their Amazon shop.
Repeat Purchase Behavior Report
The Repeated Purchase Behavior Report shows the number of orders received for each of the brand’s products, along with the number of unique customers who placed those orders. Brand owners can compare the number of orders to the number of individual customers to identify specific products that have been ordered more than once per customer within a particular timeframe. This information allows them to better assess their past marketing campaigns and strategize to drive repeat purchases and attract new customers.
Let Zuar Help With Your Amazon Data
Zuar’s Runner data solution can combine your Seller Central data with data from other sources, store it in a central database, and help you analyze this master data set. Stop looking at your data separately, within silos! Runner also integrates with Amazon Vendor Central and Amazon Advertising. Get a full picture using Runner.
Zuar is a Select Technology Partner with Amazon Web Services.
More useful Amazon content: