In this article, we discuss the fundamental building blocks for supply chain analytics, the benefits of a modern analytics approach, and how to get started.
At Zuar, we joke that our work with data is often the plumbing of the analytics world. "No one wants to talk about pipes, but everyone wants a hot shower." This feeling is echoed by professionals in any infrastructure capacity. We hear it the most with IT and Supply Chain leaders, whose phones tend to ring only when there's a problem.
However, in times of crisis, like we've experienced with COVID-19, the value of a high-performing supply chain becomes clear. If you're struggling to understand demand, track swiftly changing inventory, develop up-to-date replenishment plans or have a dream of being best-in-class in what you do, this article about supply chain analytics is for you.
Key Benefits of Modernizing Your Supply Chain Analytics Practice
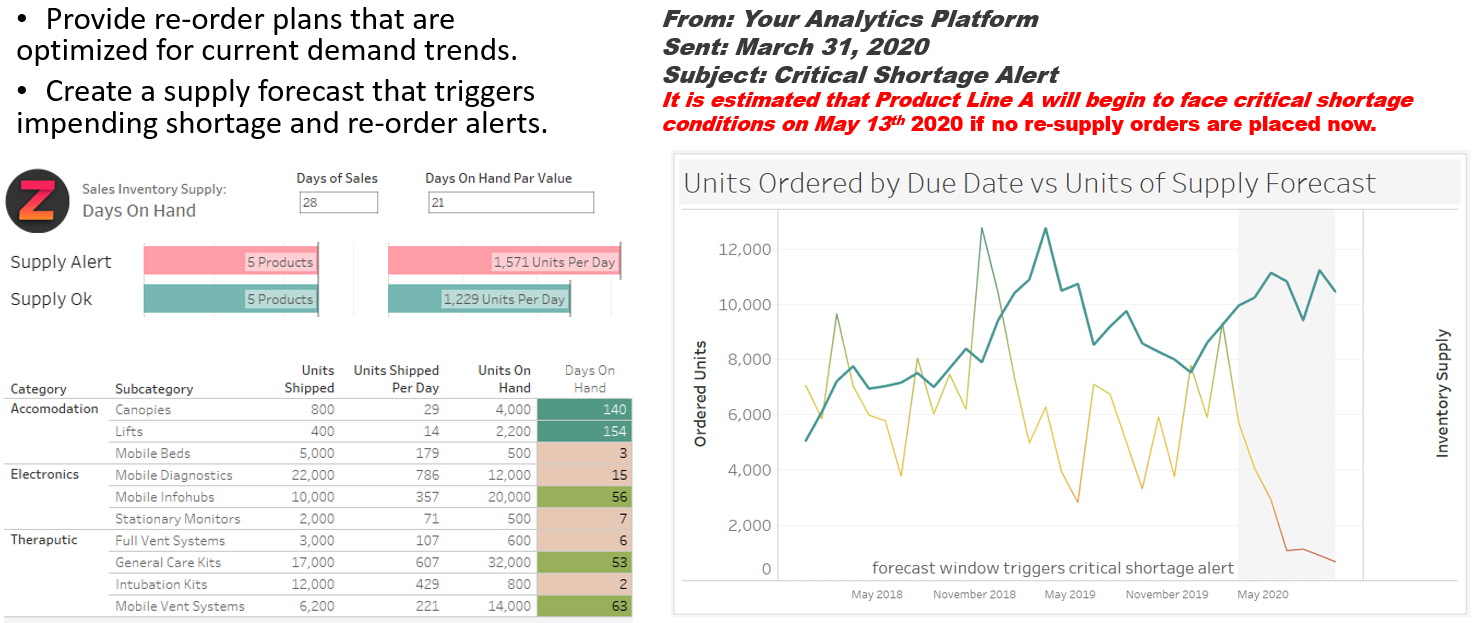
Maintaining inventory in the 'sweet spot' between critical shortage and wasteful stockpiling.
One of the biggest challenges supply chains face is an accurate insight into changes in demand. Forecasting demand versus current supply allows you to streamline ordering policies and proactively have the right flow of replenishment inbound from vendors. For manufacturing organizations, this also includes identifying and maintaining the right ratios of raw materials to fulfill finished good orders.
Reducing wasted time and product with an optimized fulfillment process.
While the first-in-first-out (FIFO) is a popular mentality, when orders suddenly spike, allocation of sales inventory to the right customers also shifts. Real time insight into changes allows you to highlight possible substitutions in your finished good or batched orders. High priority orders can be fulfilled and expedited when the actual products being requested are experiencing a shortage or delay.
Saving time and further increasing accuracy.
It's not enough to have access to information once - it needs to be up-to-date, automatically, with visibility into escalations. A modern supply analytics practice is automated from end-to-end, meaning that all necessary data flows from source systems into an analytics database, transformed and being visualized in a business intelligence dashboard. Our approach includes alerts on KPIs so that people can see and focus on the highest priority issues first.
Fundamental Building Blocks: What to Look for in Supply Chain Analytics
Across any industry, supply chain leaders are looking for the following from their supply chain analytics:
- To see and understand demand trends and open customer orders
- To see and understand current inventory and open order allocations against replenishment plans from production teams and/or vendors
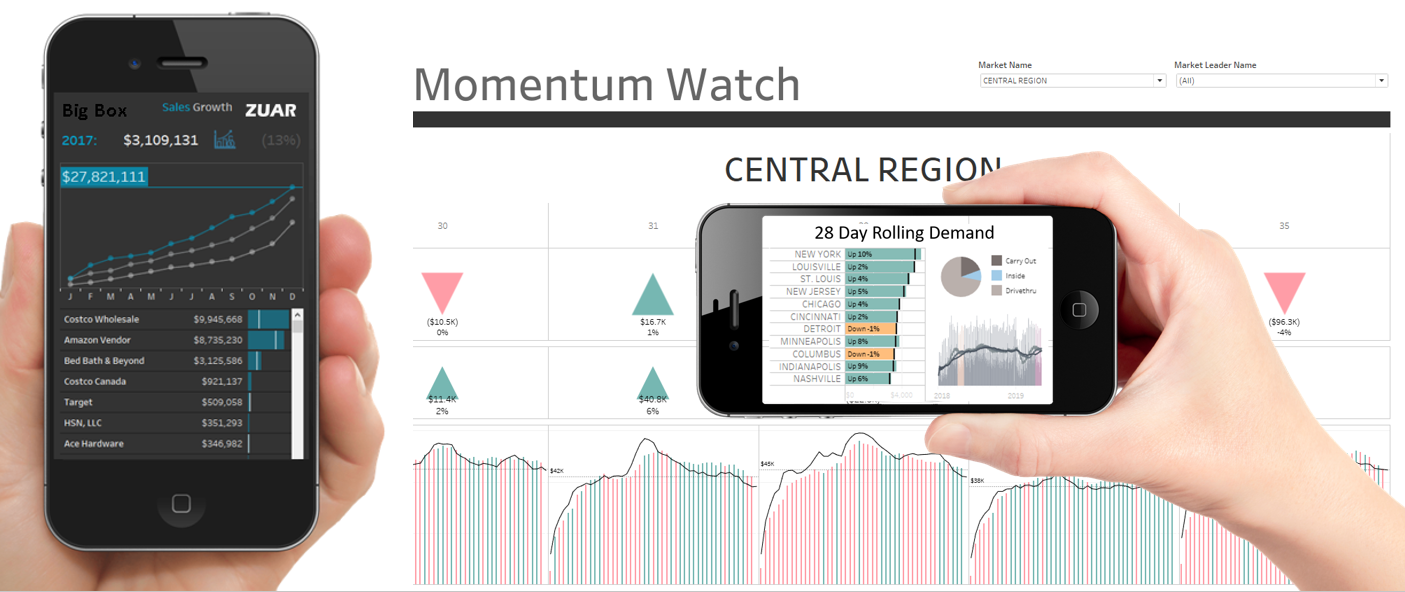
- A combination of the above to create world class forecasting, alerting, and supply chain management tools
In order to achieve this, you will need a data strategy that includes:
- An automated data value chain
As you know, daily refresh is considered the minimum viable interval to make an impact. Hourly access to new information is closer to an ideal baseline. Your data should flow from source systems to an analytical database on schedule, to be modeled for analytics on schedule, and picked up by dashboards and business intelligence platforms on schedule.
How do I get started?
There are a few key pieces of information that you will need to implement a modern supply chain analytics practice.
A data staging platform that includes:
- Database
- Pipeline that moves data from your tool into the database on schedule
- Tool that prepares data for use on schedule
A business intelligence platform that:
- Connects to databases and refreshes reports automatically
- Builds calculations and interactive dashboards
- Shares dashboards with your team, along with the ability to set up personal alerts and subscriptions
We highly recommend a data staging platform like Zuar Runner that feeds into Tableau.
Related:
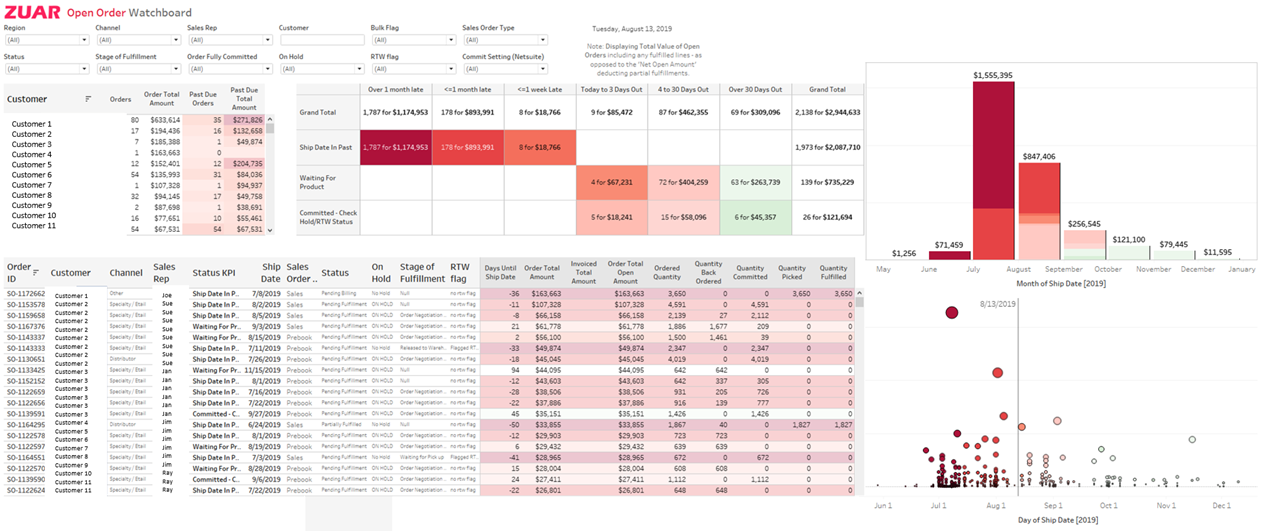
The below example shows data being pulled from Netsuite. The data staging platform, Zuar Runer, provides the database, Netsuite API and ability to transform on a schedule. Tableau connects to Runner and allows you to rapidly create and publish interactive dashboards.
Example Modern Supply Chain Analytics Practice
Regardless of your data staging or business intelligence platform, keep the following in mind when developing analytics for your supply chain.
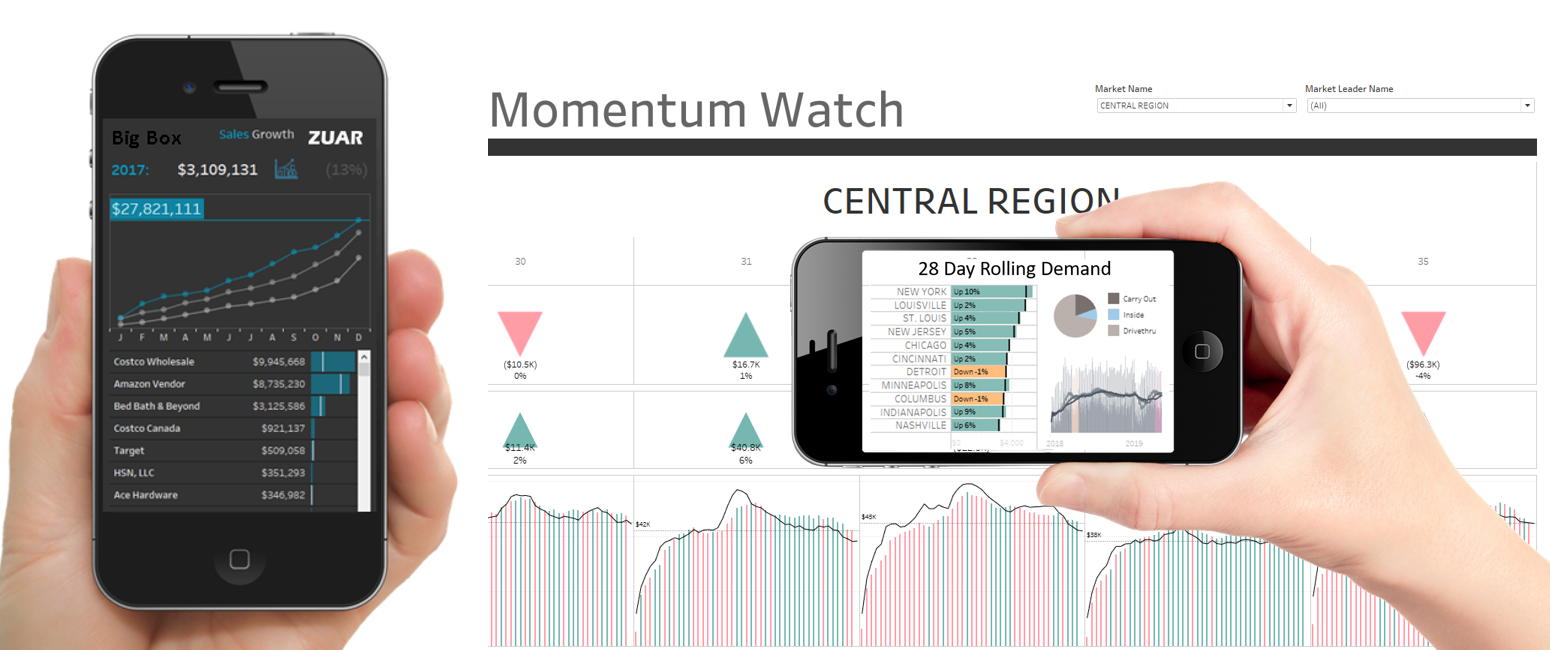
1) Demand Trends - start with identifying lines of demand like field sales, channel partners, distributor, and OEM orders. Pull in the same data they use to forecast and drill in by key locations, customer divisions, and product lines
2) Open Orders and Fulfillment - then grant your fulfillment team access to tools to see all open customer orders, shipping schedules and inventory allocation.
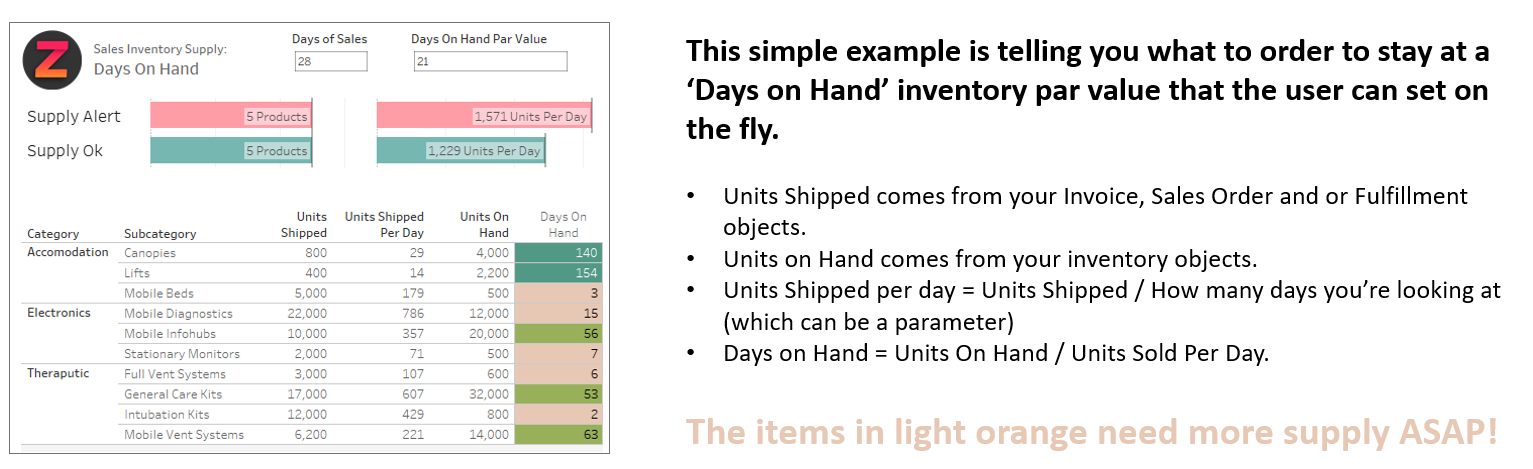
3) Current Inventory and Resupply Plan
- Capture the current picture of quantity on hand ready-to-sell goods and incoming pipeline of goods from vendors or the factory floor
- As your data practice deepens, you will know production and vendor resupply lead times so that you can optimize ordering and manufacturing start times
4) World Class Supply Chain Analytics - combine data from demand trends, open orders, current inventory and resupply plans to create powerful supply chain management tools.
In Conclusion
Just as a successful supply chain is comprised of multiple parts moving in tandem, a successful supply chain analytics practice includes an automated data strategy working with a flexible business intelligence platform. In order to maintain a schedule, everything needs to be able to be scheduled.
So, make a plan that allows for automatic data updates, automated data flow, automated refresh of reports, and automated alerts and subscriptions to vital information.
If you have questions or would like help getting started, please contact Zuar today.
Related
 Team Zuar