Customer Success Story
Emergency Assistance Foundation
"Our information was static, and it was always behind. We really needed real time data, so in times of disaster, EAF and our Fund Partners could see how many people are applying."
Doug Stockham, President, EAF
Emergency Assistance Foundation's Story
Emergency Assistance Foundation (EAF) is a 501(c)(3) public charity that helps corporations establish disaster and hardship relief funds so that grants can be awarded to eligible team members who are impacted by unexpected and unavoidable financial hardships or disasters. Early on, EAF’s typical process was to receive a spike of applications followed by a lull. During the lull, the team would process most applications in preparation for the next spike. By the end of the month, EAF had 15 days to send out a static report to their Fund Partners (organizations sponsoring a relief fund).
Emergency Assistance Foundation currently administers more than 300 relief funds, serving over 10 million individuals across six continents. Back in 2017, from August through September, 13 disasters were reported around the globe (including the well-known hurricanes Harvey, Irma, and Maria). This caused a monumental spike in grant applications. Due to this massive increase in volume, EAF needed a better way to track grant applications.
Phase 1 – Data Collection Methods. EAF started by utilizing Oracle's NetSuite ERP cloud solution. NetSuite allowed EAF to better track incidents, applications and finances. But once NetSuite was up and running, EAF realized that they also needed a way to quickly visualize and analyze the data that was flowing into NetSuite, and their current reporting tools were insufficient.
- A way to extract the data from NetSuite
- A process to transform the data so that it could be used for analytics
- A place to store the extracted and prepped data
- A way to automate the entire process
EAF found that Zuar's data staging platform, Zuar Runner, could accomplish all of this. With Zuar Runner's NetSuite integration, they were able to create an automated data pipeline that moved data from NetSuite to Runner's built-in PostgreSQL cloud database. They were then able to use Runner's sequential job runner to transform the data with custom SQL. Next, everything was set up on a schedule so that the entire pipeline ran automatically.
Phase 2 - Analyze, Visualize and Embedding NetSuite Data. Now that EAF had an automated data pipeline with curated data models, it was time to analyze, visualize, and share their insights internally and with Fund Partners. EAF selected Tableau for their business intelligence platform. Being new to Tableau and lacking the internal resources at the time, EAF needed expertise to help with analysis and visualization. EAF was able to leverage Zuar's Tableau consulting team.
After a series of dashboards were built by the Zuar team, it was time to share these insights. The dashboards were embedded into EAF's Fund Partner solution, which provided them real-time reporting.
- Ability to integrate multiple sources of data into a single source of truth.
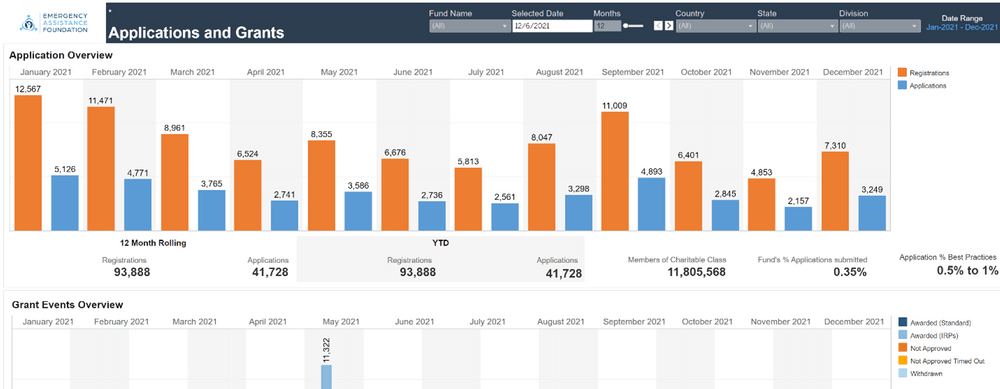
- Real-time reporting of high-level numbers embedded into Fund Partner dashboards so that they have access to stats related to number of registrants, applications, and approval rates.
- Providing Fund Partner access to grant requests.
- Improved internal communication between Fund Partners and donors.
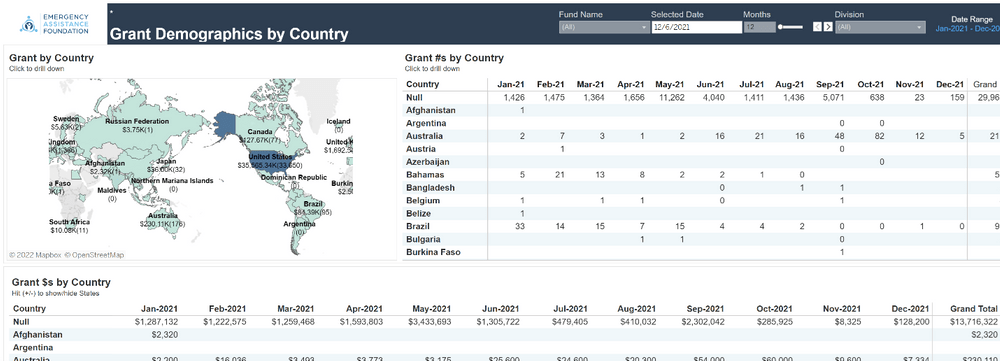
- Visibility into locations of natural disasters, how that relates to the location of team members, and where grants are being awarded.
- Improved data literacy across EAF and Fund Partners, which has also helped Fund Partners communicate with their internal teams and donors.
- Saving EAF’s time and resources thanks to the ease and automation of their reporting process.
- Application response time
- Application amounts
- How long individual reviewers are taking to review applications
- Donation amounts vs. budget amounts
- Grant amounts vs. budget amounts
- Percentage of awarded applications by day/week/month/year
- Application rate vs. percentage of eligible individuals applying within an organization
- Segmenting registrations by industry, company size, etc.
Now with easy access to these KPIs, EAF can more efficiently establish better organizational goals. They have also allowed EAF to clean up their data-entry processes, as they have started using Tableau to verify their numbers.
Since implementation, EAF’s automated, end-to-end analytics solution has improved many aspects of their business. These new systems have helped EAF award more than $60 million in grants to 76,000 individuals in 2021 alone.
See how EAF went from manual, static NetSuite reporting to fully automated, robust analytics.
Webinar On-DemandPlay around, it's interactive!
Try the Full Demo and Trial
Check out our free demo to explore Zuar Portal through analytics dashboards, a company knowledge base, and more.
- OR -
Start your two-week free trial to test Zuar Portal in your environment!