Overview
Data is the lifeblood of decision-making, and Tableau is a powerful tool for visualizing and analyzing it. With its ability to connect to a diverse range of data sources, Tableau empowers users to unlock data insights from all corners of their organization.
Are you ready to harness the full potential of your data? In this article, we’ll explore the world of Tableau data sources and connections, learn how to work with multiple data sources, and discover strategies for optimizing performance to ensure a seamless user experience.
Key Takeaways
- Explore Tableau’s data sources, including external files, database servers, web connectors, and published sources.
- Leverage joins and unions to create comprehensive visualizations from multiple tables.
- Optimize performance by utilizing best practices such as using extracts instead of live connections and refreshing data regularly for accuracy.

Exploring Tableau Data Sources
Tableau is like a master key that unlocks the door to a treasure trove of data, allowing you to:
- Connect to various data sources
- Create stunning visualizations
- Work with spreadsheets, databases, or web-based data
- Benefit from flexibility and adaptability
- Connect to external files, database servers, and web data connectors
Tableau allows you to seamlessly work with data from Excel files, SQL Server databases, and even web data connectors in a single visualization.
This versatility empowers you to extract insights from diverse data sources, enabling you to make informed decisions based on a comprehensive understanding of your data landscape. We will delve into more detail on each of these connection types.
External Files
Tableau’s compatibility with a wide range of file formats allows you to access and analyze data stored in various file types. Some of the supported file formats include:
- MS Excel
- MS Access
- JSON
- Text files
Connecting to an external file is as simple as selecting the appropriate file type in the data source tab and following the on-screen instructions.
For instance, if you want to connect to an Excel file, simply choose the “Microsoft Excel” option in the data source tab, and the sheets present in the Excel file will appear on the left side of the window.
Working with external files in Tableau is a breeze, enabling you to harness the power of your data, regardless of its format.
Whether you are analyzing sales data in an Excel spreadsheet, customer feedback in a text file, or connecting to JSON data via an API, Tableau’s support for external files allows you to create engaging visualizations that drive data-driven decision-making.
Database Servers
Tableau’s ability to connect to a variety of database servers, such as PostgreSQL, MySQL, SQL Server, and Oracle, provides you with the flexibility to work with data stored in different databases.
Combining data from various sources is possible when connecting to a database server, enabling a comprehensive and insightful tableau of information to fuel your decision-making process.
Tableau’s support for multiple database servers enables you to create complex data relationships and extract valuable insights from your data landscape, regardless of the underlying database technology.
Web Data Connectors
In our increasingly connected world, accessing web-based data sources is becoming more and more crucial for data analysis.
Tableau’s web data connectors empower you to establish connections to web-based data sources, expanding the range of data available for your visualizations and analyses.
Utilizing a web data connector allows you to:
- Tap into a wealth of information from websites and APIs
- Expand your access to data beyond traditional file formats or database servers
- Create more in-depth and comprehensive visualizations
- Provide greater insights and understanding of the data that helps drive revenue.
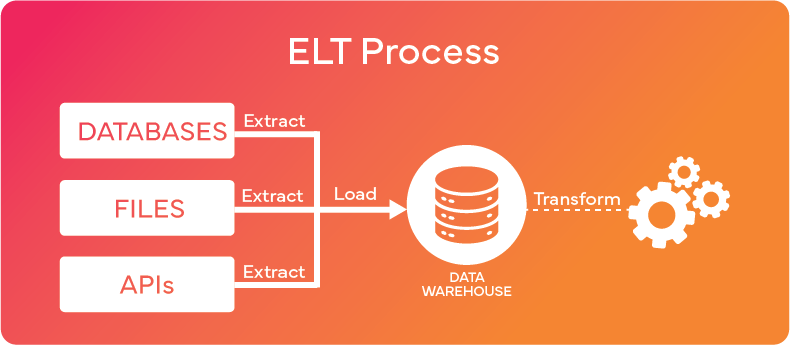
ETL/ELT Data Connectors
By utilizing an ETL or ELT platform, businesses can expand the number of data sources feeding into Tableau. ETL/ELT platforms excel at automating the collection and preparation of data from disparate sources, helping to ensure data integrity.
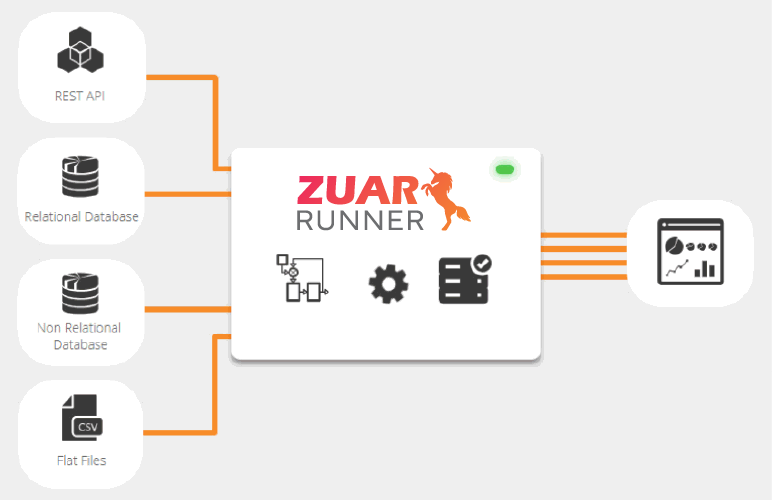
Many of these platforms, such as Zuar Runner, have pre-built data connectors to accelerate the data integration process.
Additionally, by implementing one of these third-party data connectors (as opposed to building your own connector), you can benefit from long-term support. This means that as your requirements evolve, or as your data sources get updated, your data connector will continue to be functional.
Learn more about how Zuar Runner can help you consolidate and analyze your data...


Connecting to Tableau Server or Tableau Cloud
Collaboration and data sharing are essential components of effective data-driven decision-making.
Connecting to data sources published on Tableau Server or Tableau Cloud enables access to curated data sources, separate from any associated analysis. This promotes collaboration among team members, ensuring that everyone has access to the most up-to-date and accurate data.
Published data sources offer scalability, security, and discoverability, allowing multiple users to access a consistent data source and providing a single source of truth for your organization.
Connecting to published data sources on Tableau Server or Tableau Cloud streamlines your data analysis process and fosters a collaborative data-driven culture.
Accessing Published Data Sources
Accessing published data sources is a straightforward process, whether you’re opening the workbook in which the data source is published or creating a new workbook with the published data source.
These published data sources can be accessed through Tableau Server or Tableau Cloud, providing you with the flexibility to work with your data from anywhere at any time.
Learning to access and use published data sources in Tableau allows you to:
- Reduce time to connect to and understand data
- Curate/enforce shared data definitions
- Reduce workloads on source databases
Following best practices for published data sources not only improves the quality of your analysis but also promotes trust in your data, fostering a data-driven culture within your organization.

Working With Multiple Data Sources
Tableau’s true power lies in its ability to combine data from two or more tables, allowing you to create comprehensive visualizations that tell a complete story.
With various methods like relationships, joins, and unions at your disposal, you can unlock the potential of your data by connecting multiple tables and creating complex relationships between them.
Imagine being able to analyze sales data from one source, customer feedback from another source, and product data from a third source, all within a single visualization. This level of data integration enables you to extract deeper insights and make more informed decisions.
We will delve into each of these methods to understand their potential in combining data from multiple sources.
Relationships
In Tableau, relationships are a way to combine data from different tables while maintaining their individual levels of detail. Here's a more detailed explanation:
- Preserving Data Granularity: Unlike traditional joins, relationships in Tableau do not physically merge the data at the database level. Instead, they keep the data in separate tables. This approach ensures that the original level of detail in each table is preserved. When you create a relationship, Tableau only combines the relevant rows of data at the moment of analysis, based on the fields you are using in your view.
- Flexible Data Modeling: Relationships allow for more flexible data modeling. You can relate multiple tables together without worrying about how it will impact the granularity of your data. This is particularly useful when dealing with complex data models or when you need to combine data that doesn't neatly fit into a single table.
- Contextual Joins: Relationships perform context-based joins. This means that the data is combined based on the context of the analysis you're performing. For instance, if you're analyzing sales data by region and date, Tableau will dynamically combine the data from your sales table and your region table based on those dimensions.
- Simplifying Data Analysis: By using relationships, you simplify the data analysis process. Since Tableau handles the complexities of combining the data based on your analysis context, you don't need to pre-aggregate or reshape your data before bringing it into Tableau. This makes it easier to work with large and complex datasets.
- Recommended for Most Cases: In most scenarios, using relationships is the recommended approach in Tableau, especially when working with data sources that have different levels of granularity. It provides a more intuitive and efficient way to work with and analyze your data.
Joins
Joins in Tableau are a method to combine tables based on common fields.
Whereas relationships dynamically combine data from multiple tables without altering their structure, offering flexible, context-sensitive analysis, joins physically merge data, often changing its level of detail and structure.
Tableau recommends using relationships as your first approach to combining your data because it makes data preparation and analysis easier and more intuitive. They advise to only use joins only when absolutely necessary.
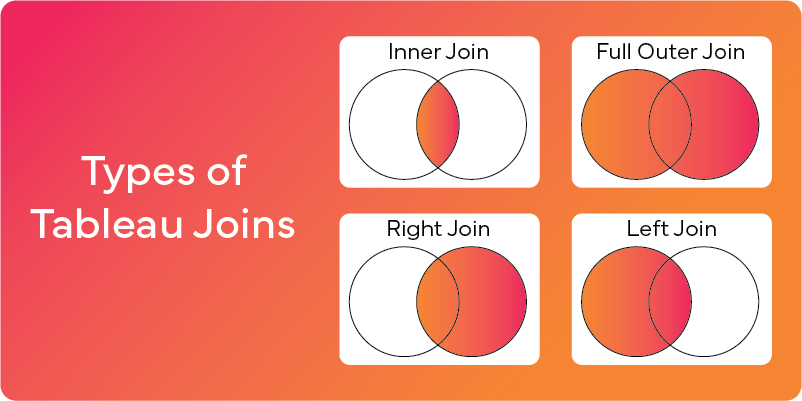
Tableau supports various join types, including:
- Inner Join: This join returns only those records that have matching values in both tables. If a row in one table does not have a matching row in the other table, that row is not included in the result set.
- Left Join: This join returns all records from the left table and the matched records from the right table. If there is no match, the result is NULL on the side of the right table.
- Right Join: Similar to the left join but in reverse; it returns all records from the right table and the matched records from the left table. If there is no match, the result is NULL on the side of the left table.
- Full Outer Join: This join combines the results of both left and right outer joins. It returns all records when there is a match in either the left or right table. If there is no match, the result is NULL on the side of the table that does not have a match.
These join types provide you with the flexibility to create the ideal data structure for your analysis.
For instance, you can use an inner join to combine sales data from one table with customer data from another table, based on a common field such as customer ID.
Unions
Union tables in Tableau provide a method to append data from tables with the same columns, resulting in a vertically extended virtual table.
This can be especially useful when consolidating data from various sources into a single table, streamlining your analysis process and providing a comprehensive view of your data landscape.
For example, you might have sales data for different regions stored in separate tables with identical columns. By using a union, you can combine these tables into a single dataset, allowing you to analyze sales performance across all regions in a single visualization.

Managing and Optimizing Tableau Data Connections
Efficient management and optimization of Tableau data connections are essential for ensuring a smooth and efficient user experience. Here are some key steps to follow:
- Understand the differences between live connections and extracts.
- Learn how to refresh data to keep your visualizations up to date.
- Implement performance optimization strategies to maximize the speed and efficiency of your Tableau visualizations. By following these steps, you can ensure a seamless data analysis experience for your users.
This section explores a variety of techniques for managing and optimizing Tableau data connections, aiding in harnessing the full potential of your data sources and creating captivating visualizations that drive well-informed decisions.
Live Connection vs. Extract
When working with Tableau data connections, you have the option to choose between live connections and extracts.
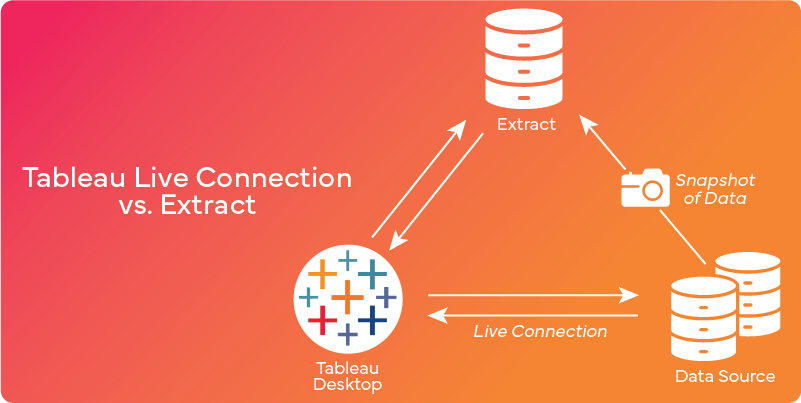
Live connections provide real-time access to your data source, ensuring that any changes made to the data are reflected immediately in your visualizations.
On the other hand, extracts involve importing and storing a snapshot of the data locally in Tableau, offering enhanced performance and customization capabilities.
The choice between live connections and extracts depends on your data size, performance requirements, and user needs. For instance, if you require immediate access to real-time data or greater flexibility in terms of data manipulation, live connections might be the better option for you.
Conversely, if you need rapid access to large datasets or more customization options, extracts may be more suitable.
Learn more about Tableau Data Extracts...
 Greg Powell
Refreshing Data
Refreshing data in Tableau is a crucial aspect of ensuring your visualizations remain up-to-date and accurate. Tableau offers three types of data refreshing:
- Full refresh: updates all data in the data source
- Incremental refresh: only updates the data that has changed since the last refresh
- Manual refresh: involves the user manually refreshing the data source.
Understanding the different types of data refreshing options available in Tableau ensures that your visualizations are always based on the most current and accurate data.
Performance Optimization
Optimizing the performance of your Tableau data connections is essential for providing a smooth and efficient user experience. By implementing best practices such as:
- Utilizing only the necessary data for your analysis
- Aggregating data when possible
- Limiting the number and type of filters
- Optimizing calculations
- Using extracts instead of live connections
You can significantly improve the performance of your Tableau visualizations.
Mastering these performance optimization strategies ensures that your Tableau visualizations load quickly and efficiently, providing a seamless experience for your users.

Making the Most of Tableau
Throughout this article, we’ve explored the world of Tableau data sources and connections, unlocking the potential of your data to drive well-informed decisions.
If you're looking to enhance your Tableau experience, consider consulting with data experts who specialize in Tableau.
As an organization with vast experience in implementing and supporting Tableau, Zuar can help you optimize your Tableau data sources and take your data visualization to the next level.
Additionally, our solutions can leverage Tableau to enhance your data stack. By using Zuar Portal, you can connect to Tableau (as well as other BI platforms such as Power BI) to consolidate all your BI reporting in one fully customizable analytics HQ.
From there, you can provide secure access to executives, employees, customers, vendors, and more.
Zuar Runner can quickly and easily connect Tableau to hundreds of potential data sources. Collect, transform, model, stage, report, monitor, and distribute. Zuar Runner automates the prep and flow of data into a single destination for analytics.
Learn more about our solutions and services by scheduling some time with one of our friendly data experts!
Team Zuar