How to Use the New Dynamic Zone Visibility Feature in Tableau
Learn how to use the new dynamic zone visibility feature in Tableau with this step-by-step guide.


Overview
With the new product launch of Tableau 2022.3 came several interesting new features. The one that really caught my eye was “Dynamic Zone Visibility”. Up until now, I have been using a DIY “sheet swapping” method where I would apply specific true/false filters to related sheets, and put them into a container together. This would allow for different sheets to be “on” or “off” based off of a condition I set but required fine tuning of padding and containers to arrange properly. But no more!
Tableau has built in an option for you to turn individual sheets “off” on your dashboard, without having to worry as much about the often tedious formatting of before.
Using Dynamic Zone Visibility, you can give users an interactive experience by changing which sheets are shown in your view based on:
- Changing a parameter
- Selecting certain marks in the view
So how does this all work? As of writing this (October 2022), I could not find any other posts or videos about how to use this new function, apart from Tableau’s documentation. So, I present to you my documentation on a simple yet powerful use case. If you are curious to see how to use this new dynamic zone visibility tool works, and how to use it to power a “sheet swapper”, this post is for you.
Want to see it in action? View a completed version of this example here.

Create a Dynamic Dashboard Zone
In this tutorial, we are going to be using the Sample Superstore data to create a simple dashboard that has two main views, and four sheets in total. We will be incorporating a parameter that will allow the end user to switch between different measures, which will dynamically change which sheets are shown in the view.
The main driver of the dynamic action will be three Boolean calculated fields- one of the few supported field types for dynamic zones. The three types are - Boolean, Single value, and as Tableau describes it “Independent of the viz, meaning the field returns a constant value independent of the structure of the viz, such as a fixed level of detail (LOD) calculation."
It might be helpful to understand before starting that Tableau uses the term “Zone” to mean an area selected on a dashboard- whether that be an individual sheet or an entire container. When reading Tableau’s tutorial, that language was confusing to me.

Building the Dashboard
1. We need to make our first, main sheet as a tree-map of profit per category and subcategory at the Superstore. On the Marks Card, bring Profit onto Size, Category onto Color, and Sub-Category onto Text.

2. Now we are going to give context to this first sheet by displaying how different sub-categories are performing when you look at the measures of Profit, Sales, and Order Count.
3. In a new sheet, bring Sub-Category onto Columns, and Profit (Sum) onto rows.

4. Do the same in new sheets for Sales and Orders (Count).


5. Let’s build our dashboard first, and then we will add in the dynamic element. I found it confusing to do it in the reverse order. In a new dashboard, bring your tree map into the view.
6. Add a horizontal container below the tree map, and add each of the additional three sheets you have created to the container (in any order).

Creating the Dynamic Zone + Sheet Swap
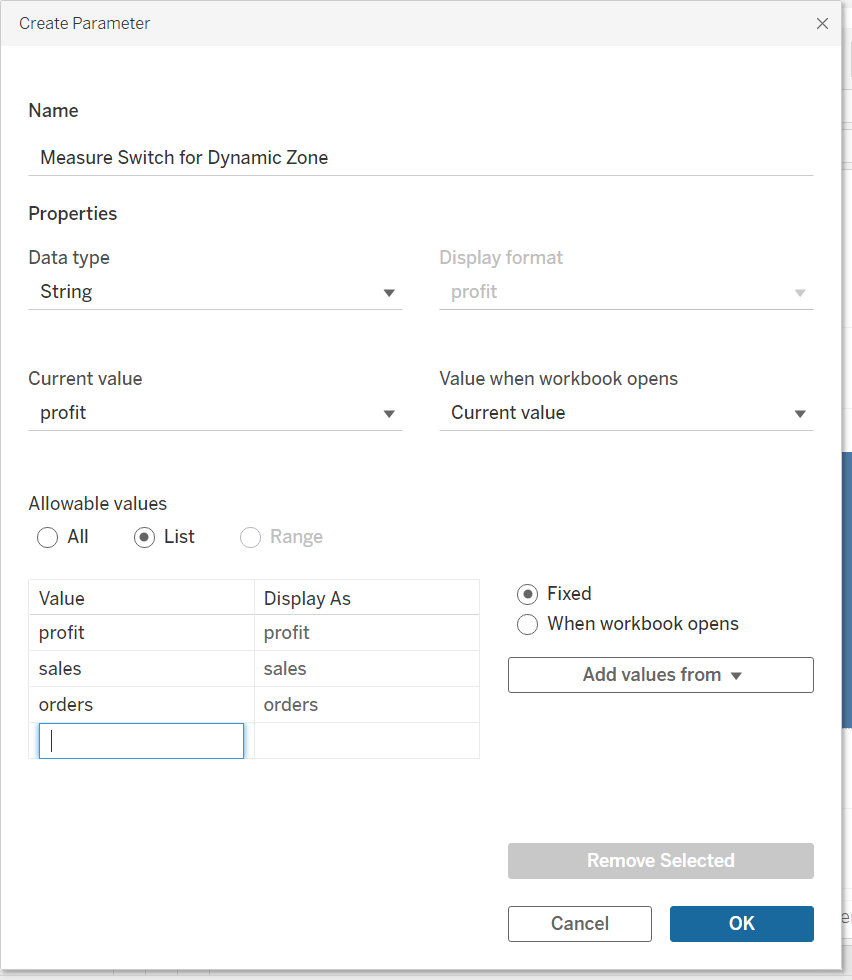
7. Go back to the Profit sheet (any of the bottom three will do). Create a new parameter- this is what is going to allow you to switch between measures and selectively show and hide the bottom sheets. It needs to be string format, and the allowable values need to be a list of profit, sales, and orders
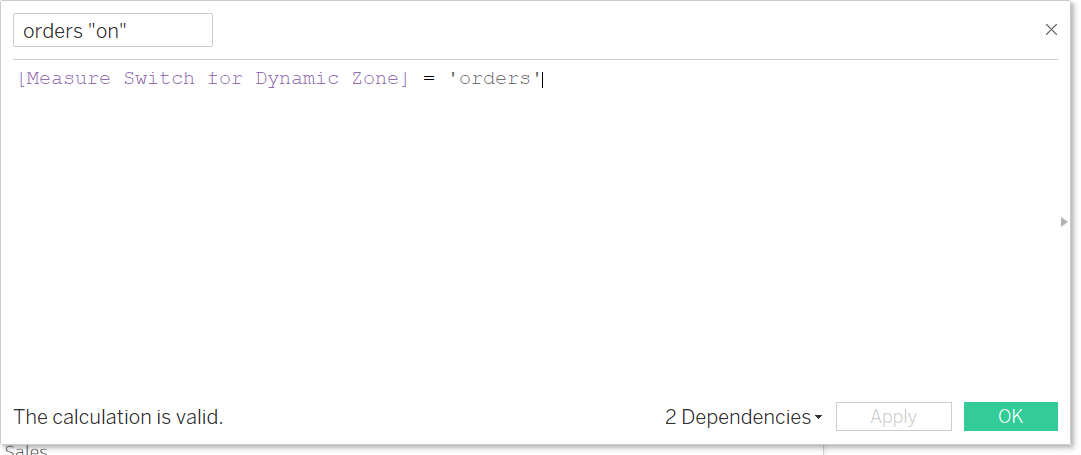
8. Create a new calculated field - this is going to be the Boolean that will drive the on/off functionality. In this field, use the formula:
[Measure Switch for Dynamic Zone] = 'profit’

9. Take your new profit “on” field and drop it onto Detail in the Marks card of your Profit sheet.

10. Duplicate this measure and repeat the process for orders and sales:
- [Measure Switch for Dynamic Zone] = 'sales’
- [Measure Switch for Dynamic Zone] = 'orders'


11. We are ready for the dashboard now! Go back to the dashboard > Click on any of the sheets > Click on the arrow dropdown > Parameters > Show the Measure Switch for Dynamic Zone parameter.

12. Click on the “Profit” sheet, and go to the “Layout” tab on the left. You will see a new menu option above the position information - a checkbox that says “Control visibility using value”. Check that checkbox, and in the dropdown to select your value, select “profit “on””. This is the field which you just created and dropped onto detail in the profit sheet, so this is why it appears here!

13. Nothing has changed for me yet, because my measure switching parameter is set to “profit”, so this sheet should stay turned “on”.
14. Click on the Orders sheet, select Control visibility using value, and this time select the orders “on” measure. Right away, the orders sheet disappeared from my dashboard, and the others resized to fill the container!

15. Click on the Sales sheet. Repeat the same process, choosing sales “on” this time in the dropdown. It will disappear as well!

16. Now, only the Profit sheet is showing. If you change the Measure Switch parameter to orders, see how the dashboard changes!

No more tedious arguing with containers, padding, and fixed heights! It’s easier than ever to change which sheet is displayed in a view on a dashboard. An additional benefit to this is that when you use the old method of putting these values on the filter shelf to turn sheets on/off, you would also have to hide the title of a sheet in order for it to work properly. With this method, you can keep the titles turned on and it will hide everything when the sheet is hidden.
This is just one use of the new Dynamic Zone Visibility Tool- The sheet swapper was my immediate thought, but I can already think of clients of mine where I will use this just to show/hide a singular sheet and have the sheets around it resize accordingly.
See and download the finished workbook on Tableau Public.
Take advantage of everything Zuar offers to companies using Tableau!
- Zuar Portals are an easy way to provide branded Tableau dashboards. Monetize your data or provide secure access outside of corporate firewalls.
- Transport, warehouse, transform, model, report, and monitor. Zuar Runer gets data flowing from hundreds of potential sources into a single destination for Tableau.
- Zuar's team of Tableau-certified consultants can take the headaches out of even the most complex projects, click here to schedule a free data strategy assessment!