
Python’s third-party package, pandas, has been a mainstay for data analysts and data scientists for quite some time. However, it can be daunting to learn pandas, with their related data analysis packages (matplotlib, seaborn, etc.) and all their coding methods and attributes. This becomes especially relevant when all you want is to quickly gain some initial insight into the data. Enter pandas profiling!
The pandas profiling library can create, in a few lines of code, a rich and interactive suite of exploratory data analysis (EDA) tables and visualizations. There is no steep learning curve or required deep understanding of multiple packages by using pandas profiling.
Related Article: Python vs. Java - Uses, Performance, Learning
Getting Started: Installing Pandas
If you are new to Python or have never installed pandas, do not fear. The pandas profiling installation will take care of all the heavy lifting for you. The only thing you will need to consider is how you wish to install pandas profiling.
Step 1: Installing pandas-profiling
Option 1 of 2: pip
If you are using Python as a stand-alone application on your machine, you will use the package installer, pip, to install pandas profiling. From your terminal (Mac) or cmd (Windows), run the following command:
pip install pandas-profiling[notebook]
The pip installation process will include everything you will need. As the pip installation runs, you will notice that it will install a LOT of packages, including pandas, Jupyter notebooks, and seaborn just to name a few.
In one fell swoop, you will have everything you need to create a profile report.
Option 2: conda
If you decided to install the Anaconda suite of applications to work with Python, you will install the pandas profiling library via the conda package installation process. Using Anaconda’s terminal, run the following command:
conda install -c conda-forge pandas-profiling
The conda installation will take care of installing everything required.
Important Note: Because the pandas profiling library relies on pandas, your version must align with the version of pandas used by the pandas profiling library. If you have an older version of pandas installed, pandas profiling may throw an error. If this happens, the resolution is to upgrade the existing version of pandas with the most recent version. Head to your terminal again and run the following command to 'force' your existing pandas to be updated.
pip install --upgrade --force-reinstall pandas
Now your version of pandas is up to date.
Step 2: Including Widgets for Your Jupyter Notebook
When creating the profile report, it takes a little time for the report to be generated. Jupyter notebook includes a widgets extension that provides some visual feedback as the report is being created. To enable this functionality, prior to opening Jupyter notebook, run the following command in your terminal:
jupyter nbextension enable --py widgetsnbextension
The widgets library, also installed during the pandas profiling installation, is now enabled.
Side note: The Jupyter widget extensions can be run in a Jupyter notebook as well. In a code cell, run the following:
!jupyter nbextension enable --py widgetsnbextension
The 'Basics': Pandas Profile Reports
To call the resulting output from the pandas profiling library “basic” is a monumental understatement. However, the code below will implement the generic output, which is called a profile report.
To create the profile report, you will:
- Import pandas
- Import ProfileReport from the pandas_profiling library
- Create a DataFrame using the data you wish to report
- Use ProfileReport() and pass in the DataFrame
It is considered standard practice to use the pandas profiling in a Jupyter notebook. This is the reason that it is included in the installation.
To open the Jupyter notebook, head to your terminal application and run the following:
jupyter notebook
The application will open in your browser. Create a new notebook (new>Python3 (ipykernal)).
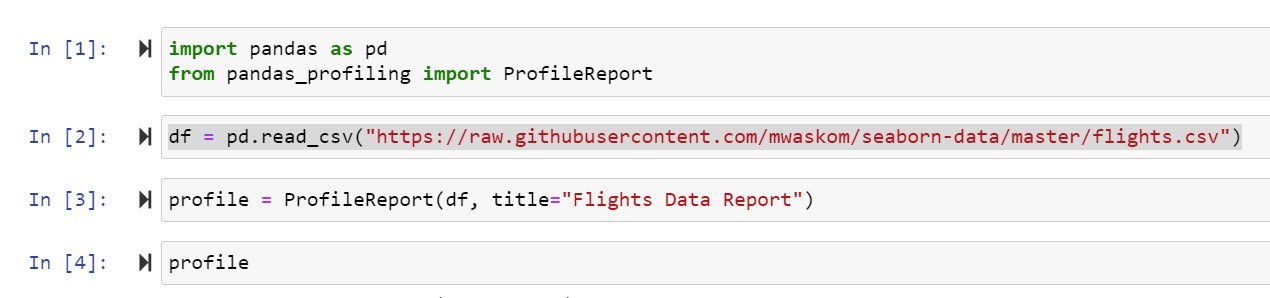
In the first cell, you will import pandas and the ProfileReport.
import pandas as pd
from pandas_profiling import ProfileReport
In either the same or a new cell, create your pandas DataFrame. This can be any data set that pandas can handle. While pandas can handle data from many different sources, a csv is always a solid choice. In the example below, I have included a data set that is free and accessible for anyone to use. The data comes from the seaborn data samples library.
df = pd.read_csv("https://raw.githubusercontent.com/mwaskom/seaborn-data/master/flights.csv")
The last step is to create the profile report. A profile report object is created as follows:
profile = ProfileReport(df, title="Flights Data Report")
With the profile object created, in a new cell type in profile to see the results. Get ready to be amazed!
Here’s a screenshot of the code in the Jupyter notebook:
Here’s a small part of the resulting report:
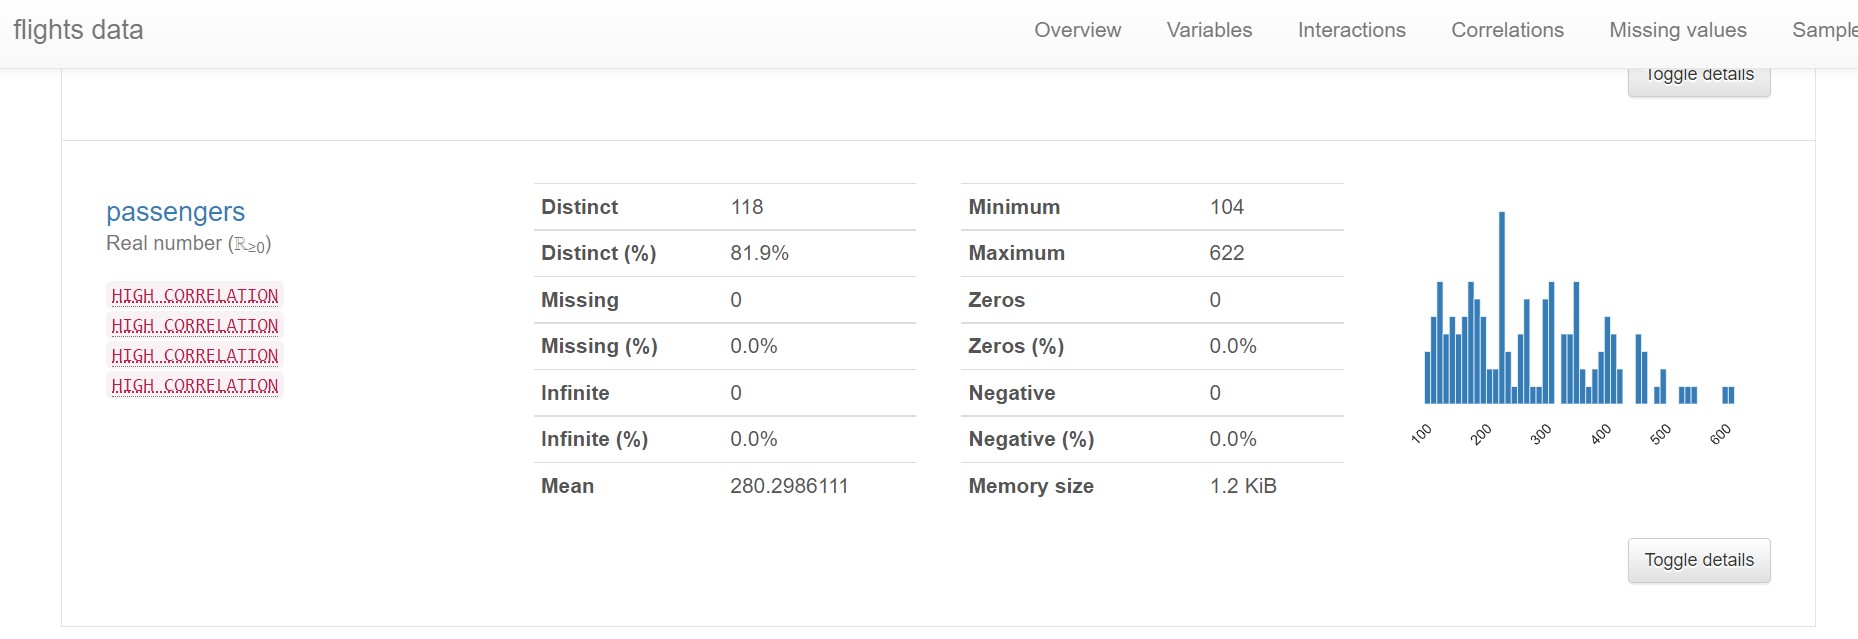
The above image represents a part of one of over five pages of data and visualizations! As stated before, this is the basic implementation. The only optional item added was the title for the report (not seen in the image above). Notice the 'Toggle details' widget. When the user clicks on the widget (button), an array of detailed information is presented to the user.
Pandas Profiling Report: Optional & Advanced Settings
The pandas profiling report has a lot of optional and advanced settings. The settings control everything from the overall visual output of the report to the various details for each chart and visualization.
Here are a few optional settings that are worth knowing:
- title: The title attribute sets the title of the report. This optional attribute is set when the profile report is being created. An example is seen above in line 3 of the code.
- to_file(): This method will output the profile report as an HTML file to be saved outside the Jupyter notebook. Note that the profile report created is an HTML file.
- EX: profile.to_file(“flights_data.html”)
There are two different ways the settings can be applied. The first option applies changes during the profile report creation as optional attributes using a dictionary. The second option uses dot notation to navigate to the desired setting, and then again uses a dictionary to set the key:value pairs. Details and examples are provided in the documentation.
 Andy Klier