How to Visualize Financial Data With Google Finance API, Google Sheets & Tableau
Looking for an innovative solution to monitor financial data? Learn how to visualize the data with Google Finance API, Google Sheets, and Tableau 2020.2

Tableau 2020.2 was a substantial release with new features like Relationships, Metrics, and Set Controls. Personally, until I am presented the opportunity to apply my skills and use these features, it never fully sets in. The below video and corresponding dashboard are just that, a workshop to help learn the new features while also building something useful in the process!
Need help upgrading Tableau Server to the latest version, or migrating to Tableau Cloud? Our certified Tableau experts can help!
Analyzing Google Finance with Google Sheets
In the following tutorial, you'll be presented with a tutorial geared toward building a 'Market Watch' dashboard with Tableau 2020.2.
You will also learn things like:
- How to build an automated data pipeline
- How to use Google Finance API
- How to build a live data stream with Google Finance API and Google Sheets
- How to live connect to Google Sheets
- Tableau 2020.2 features (Relationships, Metrics, Set Controls)
- Tableau dashboarding tips and tricks
If you successfully complete this tutorial, you will produce something that resembles:
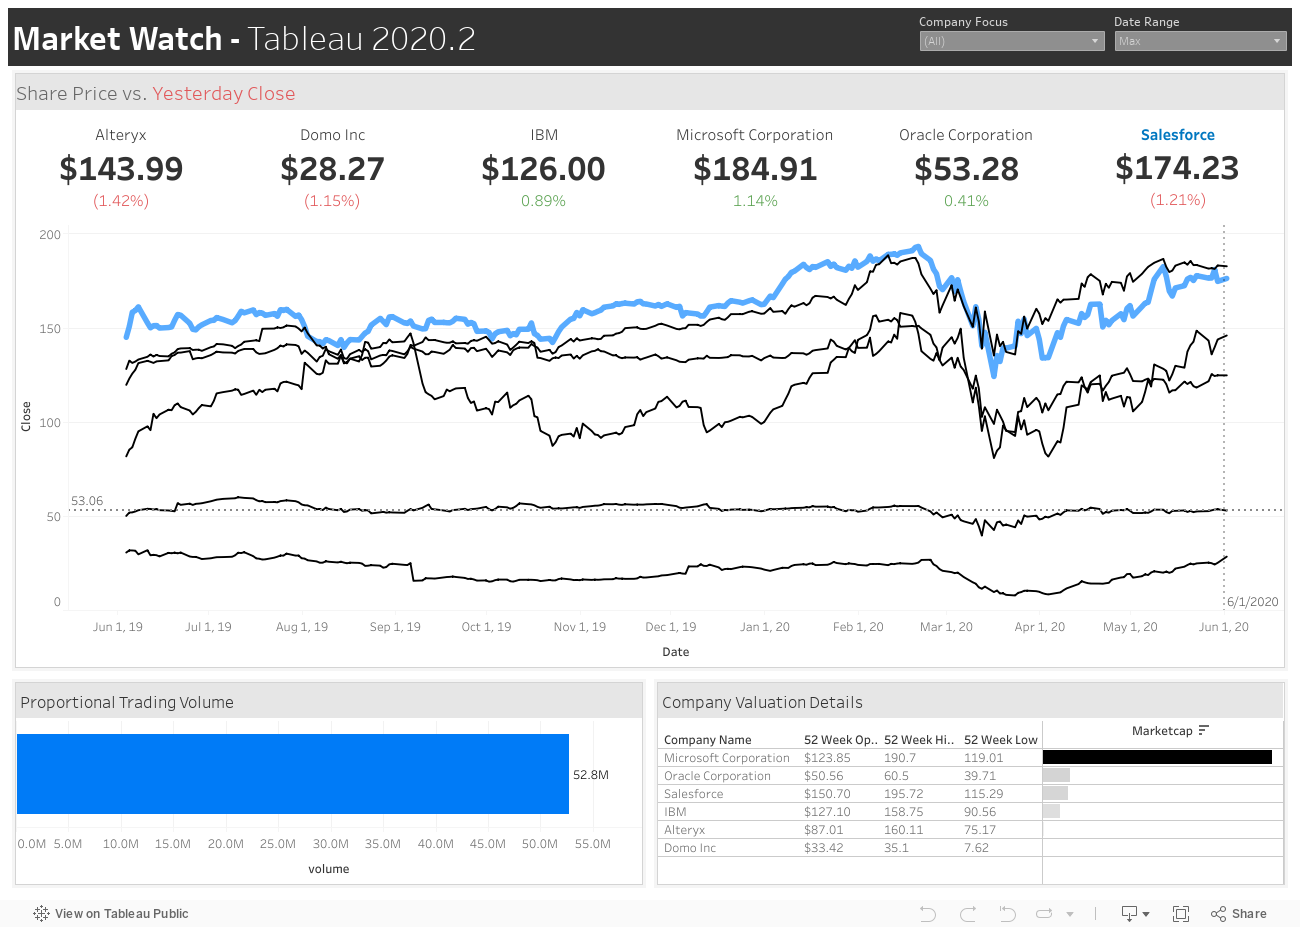
Leverage this tutorial to build your own Market Watch-style dashboard with companies that you care about, and embed it into a web page like above!
Build the Tableau Visualization!
Additional Resources
- PPT presentation: https://drive.google.com/file/d/1T7BWCkQV2zsyng2OWn-Yy04iRfhkoY6B/view?usp=sharing
- Google Finance Data: https://docs.google.com/spreadsheets/d/1hcso8qRQ7JWBcLBPPIosu1Y9iqqfF8HhrsrmogW2iug/edit?usp=sharing
- Dashboard on Tableau Public: https://public.tableau.com/profile/greg.rossi#!/vizhome/ExampleWorkbook-MarketWatch/MarketWatch
What is Google Finance and Google Finance API?
Part of the Google family of websites, Google Finance debuted in 2006. It competes with many other financial websites, including Yahoo! Finance and MSN Money.
Google Finance is a tool that reflects up-to-date market information and news. It’s implemented with the Google Search engine, so if you look up information like AAPL or Walmart for Apple, you will see an up-to-date stock quote and security data from the past. When you check out one of these stocks, it takes you to the company's Google Finance page, which provides an overview of the company’s news, finances, and allows you to make comparisons with other commodities.
Even though there are better tools to track security, Google Finance is unique because it is the only one to integrate with Google Sheets. This has become a significant game-changer for both novice and experienced stock traders because the integration is convenient to import and observe stock information in a spreadsheet. Keep in mind that Google Finance sheet integration is only offered in English and not in other languages, so it may not be a good option if you want to do any transaction on European or Asian exchanges.
In a nutshell, Google Finance helps individuals monitor their financial portfolios, provides up to date news, and provides information related to Wall Street.
What is Google Finance API?
An API (Application Programming Interface) is a set of programming code that sends instructions between one software platform to another, parses responses, and queries data. If you combine this with Google Finance, then you definitely got something special.
The Google Finance API allows you to leverage historical securities data from Google Finance so that you can build customized analysis. The Google Finance API exposes a variety of endpoints ranging from public company names/tickers to daily share prices, market capitalization, highs, lows, trading volume, and more! It can even make REST requests and return the desired data in JSON format.
How to use Google Sheets with Google Finance?
To fetch Google Finance Data from the exposed API endpoints and keep the data fresh, you will likely want to leverage Google Sheets. Google Sheets allow you to make direct calls to Google Finance and build a data table from a variety of attributes.
The standard syntax for fetching data will look something like:
GOOGLEFINANCE("NASDAQ:GOOG", "price", DATE(2014,1,1), DATE(2014,12,31), "DAILY")
GOOGLEFINANCE("NASDAQ:GOOG","price",TODAY()-30,TODAY())
Google does a nice job of explaining the syntax and attributes in this document. By following the above tutorial, you will be provided with some pre-built tables/examples and how to leverage the Google Finance API.
Live Connect to Google Sheets with Tableau
After you have built your finance data table, you can then use Tableau to live connect to the Google Sheets and begin your visual analysis. The live connection will maintain a relative level of freshness and also allow you to publish the dashboard to your Tableau Server or Tableau Public.
What's Next? Embedded Analytics
Although it was not included in this tutorial, the next practical step after the dashboard has been published would be embedding it into another application or your own application! Don't miss our tutorial on how to embed a dashboard into a web page!
Next Steps: Learn about...
- Zuar's Products
- Zuar’s Services
- Schedule a Free Data Strategy Assessment
- Zuar's Data Pipeline Quickbooks Connector

 Dorian Banutoiu