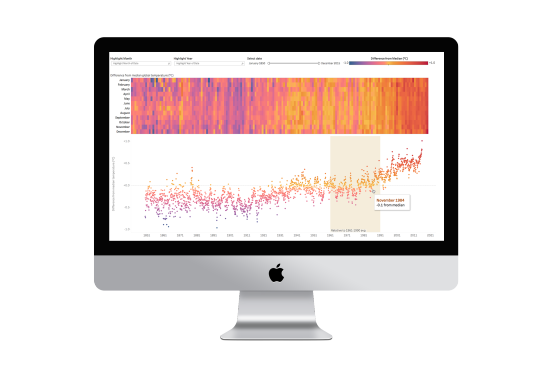
Take the NetSuite Challenge to visualize your data in Tableau!
If you are trying to analyze NetSuite Data and the standard reporting tools fall short, you're in the right place. In 5 simple steps you will have a production ready, automated visual analytics solution for your NetSuite data.
Follow these steps to experience the beauty of automation:
- Watch the video below for a full explanation of the Netsuite Challenge and Zuar’s
solution.
- Fill out the contact form. We will email you account access instructions and set up our
first call to answer any questions you have.
- We will deploy your hosted, private Zuar Runner instance and begin pulling in all of your Netsuite
data for the first time.
- When the data arrives in the Runner database, we will start your full 2-week trial of Tableau
Online, publish explorer reports and send you dashboard templates with corresponding
training videos. We’ll also set up more time to help you understand and work toward your
data driven business goals.
- After two weeks of this full trial, if you choose to continue on this journey with Zuar,
your entire automation solution is already set up from end to end and we just keep it
running for you... making you the hero your business has always needed.

The NetSuite Challenge Done Right!
We Work With Some Truly Wonderful Customers
Zuar Runner Data Staging Platform
Zuar Runner is an automated end-to-end data pipeline solution that stages data for analytics. Easily integrate data from any data source or API into a database and prepare it for analysis. We set up everything for you as a service, in the cloud or on-premise.
Learn More About Zuar Runner
Visualize your Data with Tableau.