In the fast-paced world of digital marketing, agencies and businesses are inundated with data from a multitude of platforms. Two of the most critical are Google Analytics 4 (GA4) and Meta Ads. While these tools provide invaluable insights on their own, the real challenge lies in bringing them together. The daily grind of manually exporting spreadsheets, wrestling with API quotas, and attempting to stitch together conflicting data points into a cohesive client report is a significant drain on time and resources. This fragmented process not only breeds inefficiency but also prevents the discovery of deeper, cross-platform insights that drive strategic decisions.
Many organizations turn to visualization tools like Tableau to create compelling dashboards, only to discover that Tableau is a presentation layer, not a data preparation engine [6]. It requires clean, normalized, and unified data to be effective, leaving teams stranded in the "last mile" of data analytics—the gap between raw data and actionable intelligence [7]. The core problem remains: how can you reliably automate the extraction of data from GA4 and Meta Ads, model it, and present it in a single, professional client-facing report?
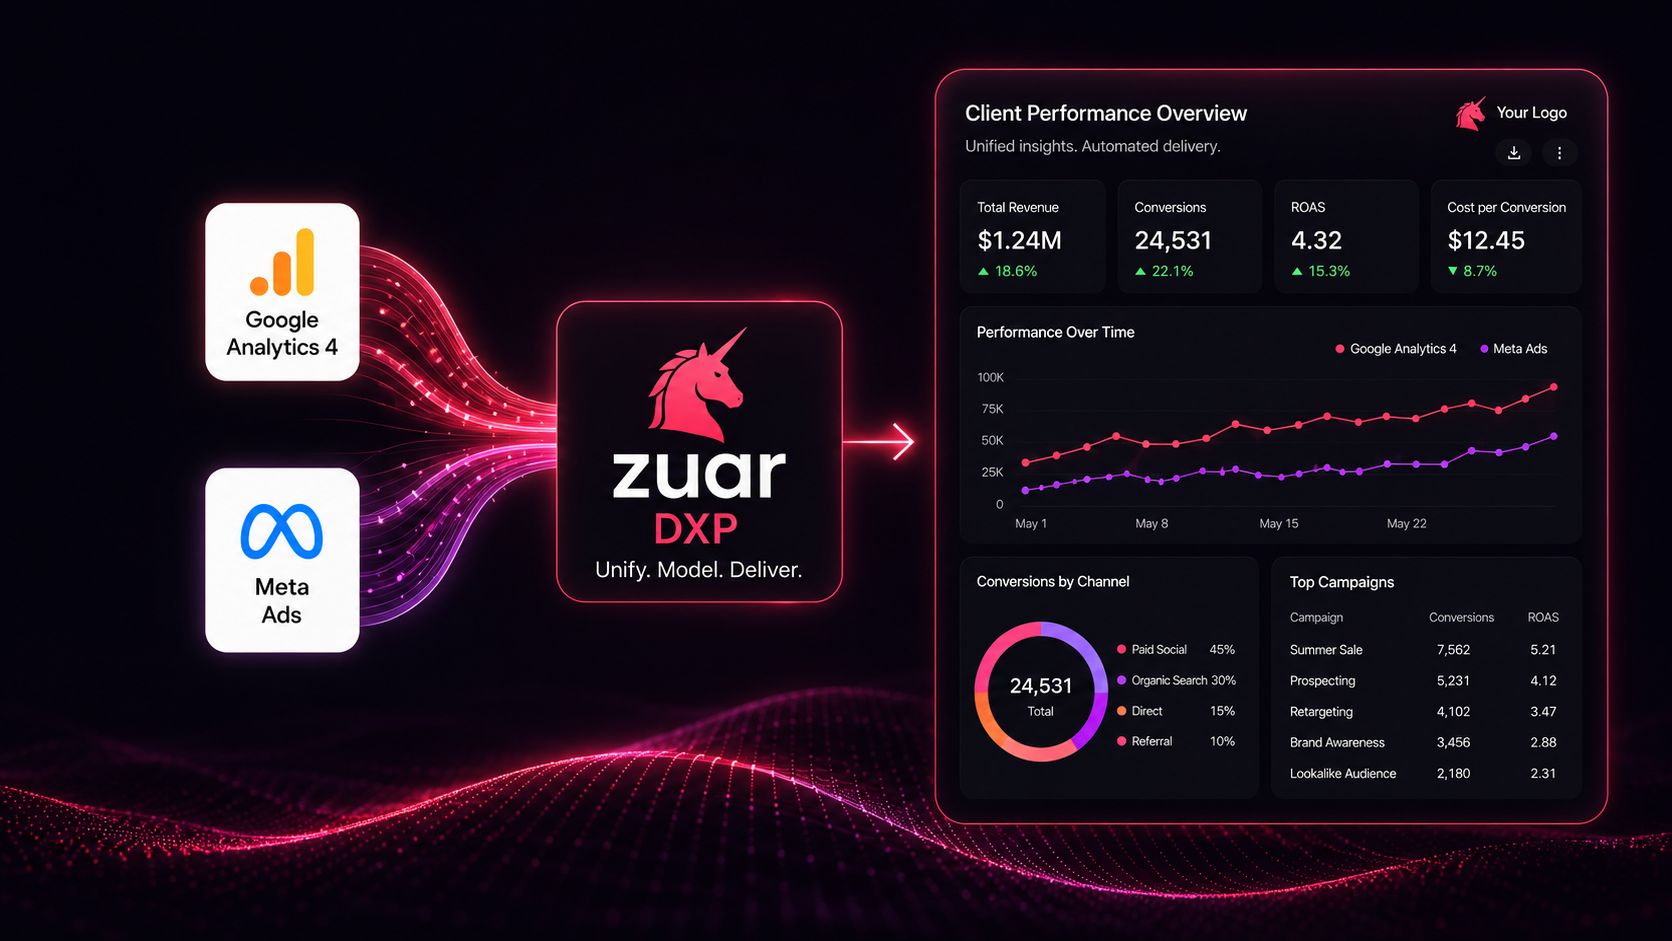
This article provides a comprehensive blueprint for solving this challenge. We will explore the technical realities of the GA4 and Meta Ads APIs, evaluate different architectural approaches, and present a definitive solution. We will demonstrate how a complete end-to-end solution, the Zuar Data Experience Platform (DXP), can serve as the central nervous system for your entire data operation, automating everything from ingestion and warehousing to modeling and delivery in a secure, branded client portal [6] [8]. While we acknowledge tools like Tableau for their role in the analytics ecosystem, we will show how they become an optional, embeddable component within a far more powerful and holistic platform [6] [11].
Methodology
This analysis was compiled on June 30, 2026. The findings and recommendations are based on a thorough review of technical documentation, best practice guides, and API reference materials from Google (for Google Analytics 4 and BigQuery), Meta (for the Marketing API), and Zuar. The report synthesizes information regarding API behaviors, data export mechanisms, rate limiting, and data modeling concepts. The objective is to provide a technically accurate and strategically sound guide for business and technical professionals, using publicly available information to contrast different data integration methodologies and highlight the capabilities of a unified data platform.
The Challenge: Why Manual and Disjointed Reporting Fails
Creating a unified report from Google Analytics and Meta Ads is a deceptively complex task. It requires navigating two distinct and intricate ecosystems, each with its own rules, limitations, and data structures. Relying on manual exports or a patchwork of disconnected tools creates a fragile, inefficient, and error-prone process that cannot scale.
First, consider Google Analytics 4. While the user interface is useful for high-level analysis, accessing raw, unsampled data for deep dives requires technical intervention. The GA4 Data API allows programmatic access but comes with quotas and complexities in defining dimension and metric combinations [1]. For more comprehensive data, Google encourages exporting event data to BigQuery [2]. However, this introduces its own set of challenges: the free tier has a 1 million event-per-day export limit, streaming exports have an associated cost and do not contain full attribution data for new users immediately, and daily batch exports are delayed [2]. Managing this requires a dedicated data engineering effort.
Next, there is the Meta Marketing API. Extracting performance data from Meta Ads is a significant technical undertaking. The API enforces strict rate limits, which are measured not just by call count but by resource consumption (CPU and time) [4]. For any substantial amount of data, synchronous requests will time out. The required best practice is to use asynchronous jobs: you must initiate a request, receive a report_run_id, poll the job's status via its async_percent_completion, and only then retrieve the results once the job is complete [3] [14]. This complex workflow, along with pravilng with various breakdowns, action_breakdowns, and attribution windows, is far beyond the scope of simple reporting tools [5].
When organizations attempt to bring this disparate data into a visualization tool like Tableau, they hit the final wall. Tableau is not an ETL (Extract, Transform, Load) platform; it is designed to visualize data that is already largely clean and structured [6]. It cannot, on its own, poll an asynchronous Meta Ads job, normalize GA4 event data from BigQuery, or model the two datasets into a unified schema. This forces teams into proprietary prep flows outside of open standards and or a cycle of manual CSV downloads, complex spreadsheet VLOOKUPS, and brittle data blends, wasting valuable analyst time on low-value data janitor work instead of high-value analysis.
The Modern Solution: A Centralized Data Experience Platform (DXP)
To conquer the chaos of modern marketing data, a paradigm shift is required—from fragmented tools to a unified platform. This is the role of a Data Experience Platform (DXP), a new category of technology designed to manage the entire data lifecycle, from initial collection to final interaction [7]. Unlike traditional Business Intelligence (BI) platforms that focus solely on read-only dashboards, a DXP is an operational hub for data consumption, action, and delivery [6].
The Zuar Data Experience Platform (DXP) is a complete, end-to-end solution engineered to address these challenges directly [6]. It provides the full stack of capabilities required to build a robust, automated reporting system, functioning as a single, governed environment for all your data operations.
At its core, Zuar DXP consists of two integrated components [6]:
- Zuar Runner (Backend): This is the powerful data pipeline and automation engine. Zuar Runner handles the automated ELT/ETL processes, connecting to hundreds of sources to extract, load, transform, and model data [8]. It orchestrates the entire backend workflow, ensuring data is clean, normalized, and analysis-ready.
- Zuar Portal (Frontend): This is the white-label experience layer. The Zuar Portal is where internal teams or external clients consume and interact with data [9]. It serves as a secure, brandable hub for dashboards, reports, and custom applications, moving beyond static visualization to an interactive data experience [6].
Crucially, Zuar DXP includes a built-in, high-performance data warehouse, which serves as the central repository for all your ingested data. This eliminates the complexity and cost of procuring and managing a separate warehouse solution. For organizations already invested in other ecosystems, Zuar DXP remains flexible, offering the option to use an existing warehouse like Google BigQuery as the destination [6]. This combination of a powerful backend, an integrated warehouse, and a flexible front-end makes Zuar DXP the definitive platform for automating client reporting.
How To: Build Your Automated Reporting Pipeline with Zuar DXP
Here is a practical, step-by-step guide to automating the entire workflow—from data extraction to a unified client report—using the Zuar Data Experience Platform.
Step 1: Unify Your Data Sources with Zuar Runner
The first step is to automate the extraction of data from all your sources into a central location. Zuar Runner, the data pipeline engine of Zuar DXP, provides a versatile toolkit for this purpose, adaptable to any data source.
Using No-Code API Connectors
For common platforms like Google Analytics and Meta Ads, Zuar Runner offers pre-built, no-code connectors that handle all the underlying API complexity.
- Google Analytics (GA4): The Zuar Runner connector for Google Analytics simplifies data extraction significantly. It intelligently interacts with the GA4 Data API, automatically handling pagination for your selected dimensions and metrics to avoid the common pitfalls of data sampling [12]. For enterprise-scale needs, the connector can be configured to pull data directly from your Google Analytics BigQuery Export, whether it's the daily batch or streaming data. This turnkey solution replaces the need for custom scripts to manage BigQuery table schemas and process delays.
- Meta Ads: The Meta Ads connector is engineered to master the complexities of the Marketing API. It automates the entire asynchronous reporting workflow, managing
report_run_idpolling and checkingasync_percent_completionbehind the scenes [8] [14]. It also adeptly handles rate limits by monitoring headers likex-fb-ads-insights-throttleand implements intelligent back-off mechanisms [13]. This allows you to pull detailed performance data with any combination of metrics and breakdowns without writing a single line of complex polling or error-handling code.
Creating Custom Connections for Everything Else
When a pre-built connector isn't available, Zuar Runner provides a "blank canvas" for custom integrations.
- Python Jobs: Zuar Runner includes a dedicated Python Job connector that allows you to run custom Python scripts within its governed environment [15]. You can use standard libraries like
requeststo interact with any REST API, inheriting Zuar Runner's robust orchestration features like scheduling, logging, alerting, and secure management of credentials and API keys [10]. This is the perfect solution for connecting to niche marketing platforms or internal APIs. - File Ingestion: Marketing data doesn't always come from an API. For data exported as CSV, JSON, or Excel files, Zuar Runner can be configured to automatically pick up files from locations like an SFTP server, Amazon S3 bucket, or Google Drive, and ingest them into your data pipeline [16]. This automates the process of handling periodic data dumps from clients or third-party platforms.
- Web Scraping: As a method of last resort when no API or file export is available, Zuar Runner's Python Job capability can be used to execute web scraping scripts [16]. By running scrapers within the secure and orchestrated Zuar environment, you gain reliability and monitoring that standalone scripts lack, though an official API is always the preferred method.
Step 2: Staging, Modeling, and Normalization in Zuar's Warehouse
Once your data is ingested, it lands in a staging area within the Zuar DXP's integrated data warehouse [17]. This is where the critical work of transformation and unification happens. Unlike traditional approaches that require a separate data warehouse, Zuar DXP provides this capability out-of-the-box.
Using standard SQL, your data team can now work within the Zuar platform to model the raw data from Google Analytics and Meta Ads into a single, cohesive source of truth [17]. This process involves:
- Cleaning and Normalization: Standardize date formats, resolve status aield discrepancies, and parse campaign naming conventions to create consistent fields across datasets [17].
- Data Modeling: Create a unified schema, such as a star schema, that joins the data together [18]. You can build dimension tables for
date,campaign, andad_creative, and a central fact table that combines GA4 metrics (likesessions,users,conversions) with Meta Ads metrics (likespend,impressions,clicks). This unified model is what enables true cross-platform analysis and reporting. - Flexibility with BigQuery: If your organization is already standardized on Google Cloud, Zuar DXP can seamlessly integrate with your existing BigQuery project, using it as the target warehouse instead of the built-in option [6]. Zuar Runner will orchestrate the loading and transformation of data within your BigQuery environment, providing the same powerful modeling capabilities.
Step 3: Delivering Insight with the Zuar Portal
With a clean, unified dataset ready in your warehouse, the final step is to present it to your clients. This is where the Zuar Portal shines, offering a solution that is far more integrated and powerful than simply pointing Tableau at a database [9].
The Zuar Portal is a fully brandable, secure, and interactive web environment for delivering analytics. Instead of sending clients a link to a standalone Tableau dashboard, you provide them with a login to their own custom portal.
- The Complete Front-End: The Portal itself can be the analytics experience. Using Zuar's "vibecoding" (AI-assisted development) capabilities, you can build fully custom visualizations and interactive components using HTML, JavaScript, and D3.js directly within the platform [19]. This allows for bespoke data experiences that go beyond the limitations of standard BI tool widgets.
- Tableau as an Optional, Embedded Component: If your organization has an existing library of Tableau dashboards, you don't have to discard them. The Zuar Portal is designed to embed content from multiple BI vendors—including Tableau, Power BI, and ThoughtSpot—on the same page [11]. This allows you to leverage your existing assets while wrapping them in Zuar's secure, branded, and extensible environment. Tableau becomes just one piece of content within a much richer data portal, positioned alongside custom reports, written summaries, and other assets.
- Beyond Reporting: Zuar DXP transforms reporting from a passive activity to an active one. With native data writeback capabilities, you can build applications where a user can annotate a dashboard, change a campaign's budget, or trigger a workflow in another system directly from their analytics report, truly closing the loop between insight and action [6].
Zuar DXP vs. Alternative Approaches
To understand the value of an integrated platform, it's useful to compare it against common alternative setups. The Zuar DXP provides a cohesive, managed, and scalable solution that drastically reduces the complexity and total cost of ownership compared to a do-it-yourself or BI-only approach.
| Feature / Capability | Zuar DXP (Integrated Platform) | DIY Approach (Python + Connectors + Tableau) | Traditional BI Alone (Tableau) |
|---|---|---|---|
| Data Ingestion | Unified suite of no-code connectors, Python jobs, and file ingestion, all orchestrated and managed [8]. | Requires stitching together disparate tools: custom Python scripts, third-party connectors, and manual API management. | Not a core function. Relies proprietary prep flows, manual file uploads or direct queries to already-prepared data sources [6]. |
| Data Warehousing | Includes a built-in, high-performance warehouse. Optionally connects to existing warehouses like BigQuery [6]. | Requires procuring, configuring, and managing a separate data warehouse (e.g., BigQuery, Snowflake). | No true warehousing capability. Requires a separate, managed data warehouse to connect to. |
| Modeling & Transformation | Powerful, integrated SQL-based modeling environment within the platform's orchestration framework [17] [18]. | Transformations handled by disparate scripts (e.g., dbt, Airflow, custom Python), creating complex dependencies. | While some transformation and modeling is possible, best practice is to transform data before it gets to Tableau [6]. |
| Visualization & Delivery | Integrated, white-label portal with custom visualization options and embedding for any BI tool [9] [11]. | Tableau serves as the front-end, but requires separate hosting, security, and user management. Lacks an integrated portal experience. | The core function, but a "dashboard graveyard" risk if not integrated into business workflows. |
| Governance & Security | Centralized governance, Row-Level Security (RLS), and SSO managed across the entire stack from a single platform [10]. | Security and governance must be implemented and managed separately for each component (scripts, warehouse, Tableau). | Provides robust security for dashboards, but does not govern the upstream data pipeline. |
| Maintenance Overhead | Fully managed platform with support. Zuar maintains all connectors and infrastructure [6]. | High overhead. Team is responsible for maintaining custom code, updating API clients, and managing server infrastructure. | Low for the BI tool itself, but high for the entire data ecosystem required to feed it. |
Actionable Takeaways
The days of struggling with manual data exports and fragmented reporting tools are over. To thrive in a data-driven world, businesses and marketing agencies need a robust, automated, and scalable solution for managing client reporting.
Here are the key takeaways:
- Fragmented Tools Create Fragile Systems: Relying on a patchwork of manual processes, custom scripts, and standalone BI tools is inefficient, error-prone, and unscalable. The technical realities of modern APIs like those from GA4 and Meta Ads demand a more sophisticated approach [1] [3].
- A Unified Platform is the Solution: A Data Experience Platform (DXP) like Zuar DXP provides the end-to-end capabilities needed to automate the entire reporting workflow. It solves the problem at its root by integrating the data pipeline, warehouse, modeling, and presentation layers into a single, governed ecosystem [6] [7].
- Tableau is Part of the Answer, Not the Whole Solution: Visualization tools are essential, but they are only one piece of the puzzle. Zuar DXP positions Tableau as an optional component that can be embedded within a more comprehensive, secure, and interactive client portal, unlocking its full value without making it a dependency [6] [11].
- Automation Frees You to Focus on Insight: By automating the entire data supply chain with Zuar DXP, you liberate your team from low-value data preparation tasks [8]. This allows them to focus on what truly matters: analyzing data, uncovering strategic insights, and delivering exceptional value to your clients.

Frequently Asked Questions (FAQ)
- Do I need Tableau to use Zuar DXP?
No, you do not. Zuar DXP is a complete, standalone platform. Its frontend component, Zuar Portal, allows you to build and host fully interactive reports and custom data applications [9]. While it can seamlessly embed Tableau dashboards if you already use them, it is not a requirement [11]. Many Zuar customers use the Zuar Portal as their sole front-end for both internal and external analytics. - How does Zuar DXP handle changes to the Google Analytics or Meta Ads APIs?
Zuar manages and maintains all of its pre-built connectors. When Google or Meta updates their APIs, the Zuar engineering team updates the connector to ensure continued compatibility and performance. This is a key benefit of a managed platform, as it removes the burden of API maintenance from your team [6]. - Can Zuar DXP connect to our proprietary, in-house data sources?
Yes. Zuar Runner's versatile toolkit is designed to connect to any data source. For proprietary systems with a REST API, you can use the Python Job connector to write a custom script for data extraction [15]. If your system can export data to files, Zuar Runner can automate ingestion from SFTP or cloud storage [16]. This flexibility ensures all your data, not just data from major platforms, can be integrated. - Is the built-in data warehouse in Zuar DXP secure?
Yes. Zuar DXP is designed with enterprise-grade security as a core principle. The platform runs in isolated, single-tenant instances, ensuring your data is never co-mingled. It enforces governance policies, including Row-Level Security (RLS) and user-based access controls, across the entire data lifecycle [10].