
Why hospital COOs and the firms that serve them are moving to Data Experience Platforms
Key Takeaways
- Traditional BI tools were designed for analysts, not operators. Hospital COOs need operational intelligence applications — self-contained, app-like experiences that model complex decisions, cross-filter across multiple views, and surface the right data to the right person in context. A charting library alone cannot produce this.
- The BI category is splitting in two. On one side: tools optimized for drag-and-drop dashboards and analyst exploration. On the other: Data Experience Platforms (DXPs) — governed, multi-audience application layers that handle the full journey from complex source data to action-oriented analytics. Zuar DXP is built for the second category.
- For professional services firms, the platform choice determines what you can promise clients. A firm delivering analytics on Zuar DXP can build self-contained application experiences — custom visualizations, cross-filter architecture, live data interactions — and hand clients a production-grade tool that looks and works nothing like a standard BI report.
- The development spectrum matters. No-code for standard views. Low-code for configurable templates. AI-assisted (vibecoded) for custom logic. Full-code for anything the browser can render. MCP-driven agent development for the full build loop — AI creates datasources, writes queries, builds blocks, and configures pages programmatically inside Zuar's governed framework.
- The proof is a working perioperative command center. Zuar's OR Block-Time Yield & Capacity-Loss Command Center — built through the Zuar MCP server using Claude Code — demonstrates what "beyond BI" looks like in healthcare operations: interactive SVG floor plans, eleven-component capacity bridges, cross-filtering across seven coordinated views, running on a real SQL engine datasource that can swap to production warehouse connections.
The Real Problem With Hospital Operations Analytics
Hospital COOs are not short of data. Most large health systems have invested significantly in data infrastructure — EHR analytics, costing systems, workforce dashboards, operational scorecards. The problem isn't data volume. It's what the analytics layer can actually do with it.
The tools that have dominated healthcare analytics for the past decade — Power BI, Tableau, Qlik — were designed to answer one question: "What happened?" A chart. A table. A KPI tile updated on a schedule. That was the right answer for a reporting era when the audience was a data analyst preparing a weekly review.
A hospital COO operating in 2026 needs something different. They need an analytics experience that can model the operational picture in real time: surgical capacity and the specific categories of loss driving idle prime time; staffing utilization broken down by role, unit, and shift; case contribution margin mapped against block allocation; patient flow through high-acuity units with threshold-triggered alerts. These are not questions a standard dashboard answers. They're questions an operational application answers.
There is a meaningful difference between those two things — and understanding it is the starting point for any hospital or professional services firm evaluating their analytics platform in 2026.
 Joel Stellner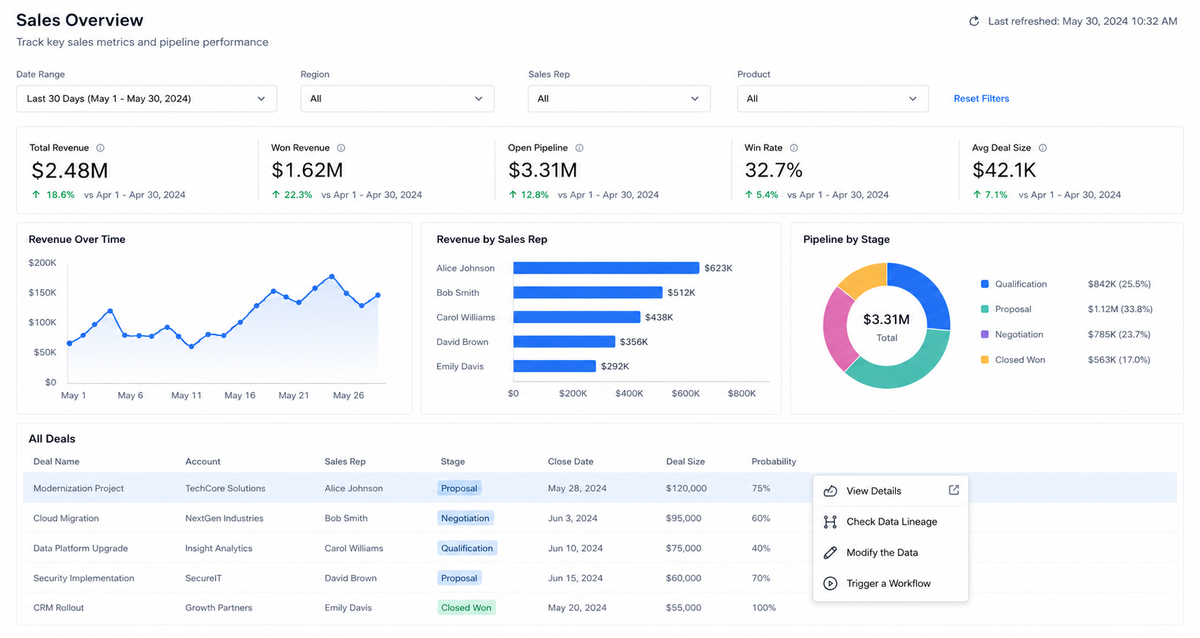
What Traditional BI Cannot Do for Hospital Operations
Here is the structural reality of the tools that dominate Gartner's Magic Quadrant for Business Intelligence: they are visualization layers built on read-only data models, constrained to a proprietary charting builder, with multi-audience serving as an afterthought addressed through expensive OEM licensing.
For hospital operations, this creates specific and predictable failures:
They can't model complex operational logic. An OR capacity bridge that decomposes every allocated prime-time minute into eleven signed components and asserts that they sum correctly in-database — and then re-verifies in the browser — is not a chart. It's an application. Traditional BI has no architecture for this. You get a table or a bar chart. The logic that makes it meaningful is invisible.
They treat data as read-only. Hospital operations generate decisions, not just observations. A perioperative finance leader approving a block reallocation, a nursing supervisor updating staffing classifications, an operations analyst flagging a threshold breach for follow-up — all of these should happen inside the analytics environment, with the action recorded back to the data layers or operational systems themselves.
They serve one audience at a time. A COO, a service line director, an OR medical director, an external surgical group, and a professional services firm analyst all need different views of overlapping data — scoped by role, organization, and relationship. Serving multiple audiences securely, from the same governed data layer, with full white-label branding control per audience, requires platform architecture that traditional BI was never designed to provide.
They scale cost with external audience size. Delivering analytics to external stakeholders — surgical group partners, affiliated facilities, referring physicians, consulting firm clients — through traditional BI requires OEM licensing that prices out most organizations before the project launches.
They cannot host application-grade custom visuals. An interactive SVG floor plan where every OR is a clickable polygon connected to a live query layer. A Gantt swimlane of job execution across a scheduler. A D3.js dependency graph that zooms, pans, and updates on click. These are browser experiences, not chart library extensions. Traditional BI platforms cannot produce them. Their architecture is the constraint.
What a Data Experience Platform Changes
A Data Experience Platform is not a rebranded BI tool. It is a governed application layer that integrates with your data infrastructure and handles the full journey from complex source data to operational analytics experiences for every audience.
Zuar DXP has three core components:
Zuar Runner handles data acquisition, transformation, pipeline orchestration, and custom job execution — SQL, Python, and BASH — connecting to any source a hospital or professional services firm needs: EHRs, costing systems, scheduling platforms, workforce tools, flat files, and custom APIs. Clean, modeled, analytics-ready data delivered on schedule, without hammering operational systems.
Zuar Portal is the application layer — a governed environment where data experiences are built and delivered. Standard no-code drag-and-drop for routine views. Low-code template blocks for configurable reporting. AI-assisted (vibecoded) block development for custom logic and visualizations. Full-code HTML, CSS, and JavaScript for anything the browser can render. Every output lives inside the same governed framework, with Row Level Security enforced at the connection level, SSO and IDP integration, block-level content security per role, and complete white-label branding control per audience.
Zuar Labs delivers the services layer: architecture, data modeling, portal design, and training for organizations that need a fast path from contract to production.
What this combination enables — and what separates it from every BI tool in the market — is a development spectrum that goes all the way to the browser. Analysts describe what they need. AI writes the code. The code renders in a governed Portal block. The result is an operational application, not a dashboard template.
 Joel Stellner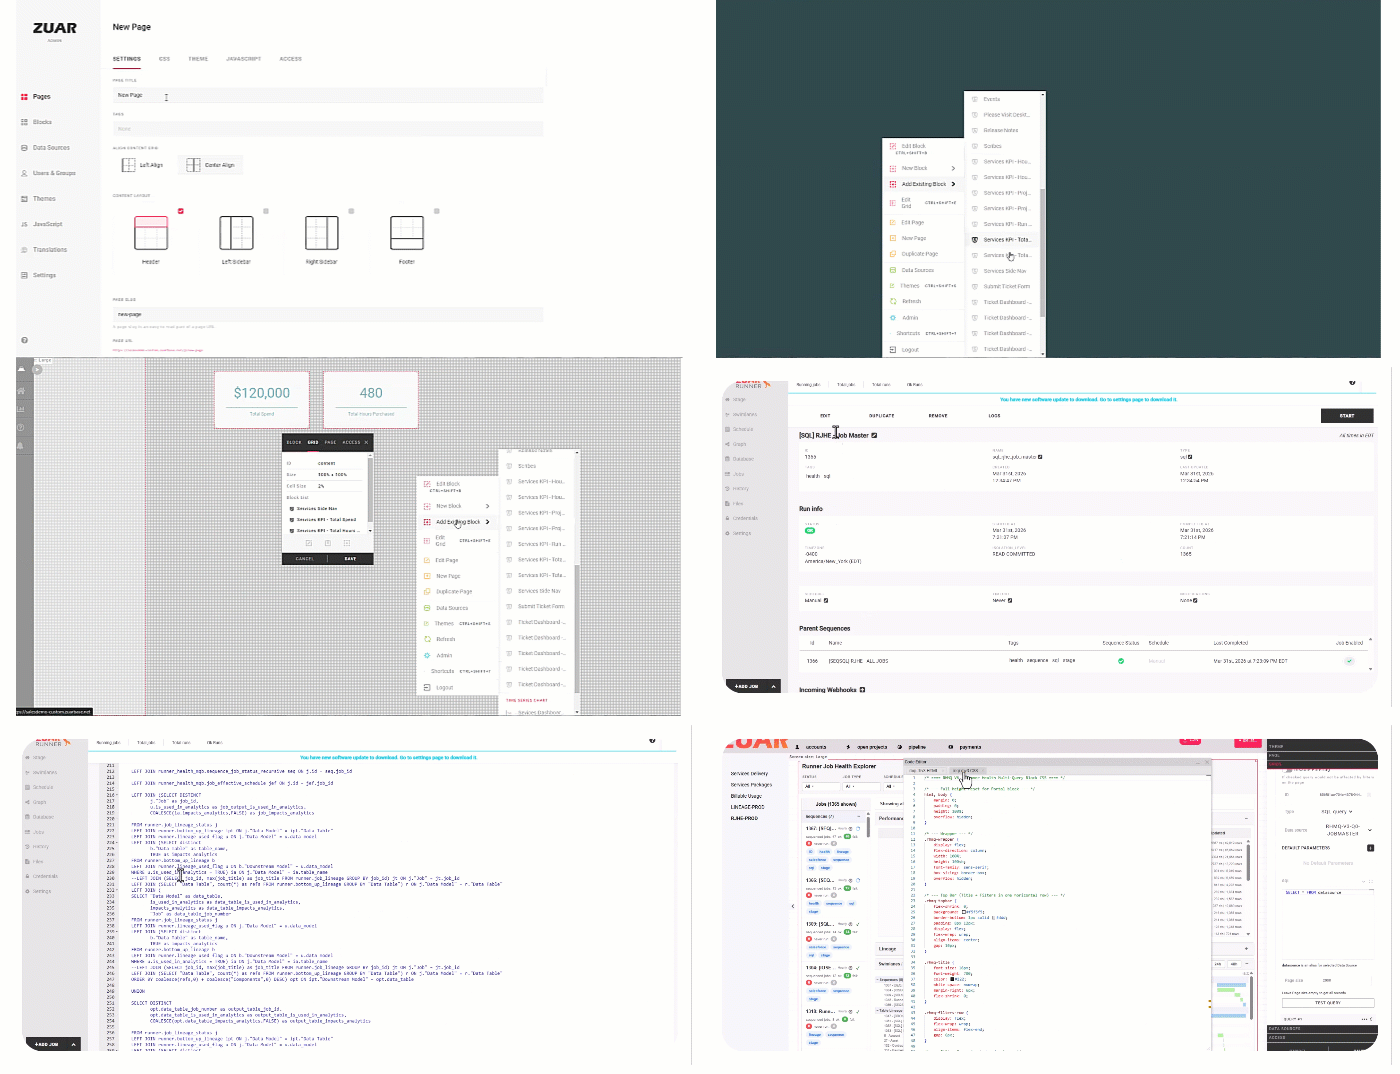
The Development Spectrum: From No-Code to Agent-Driven
For hospital analytics teams and professional services firms, the platform's development model is as important as its feature set. The question is not just "what can it produce?" but "how fast can my team produce it, and how far can they go?"
Zuar DXP supports a complete development spectrum:
No-code — drag-and-drop portal builder, pre-built connectors, GUI-based configuration. A business analyst with no technical background can build a governed, branded analytics portal from a configured data connection.
Low-code — template-based blocks with configurable parameters. SQL queries drive visual components without requiring front-end development. Data teams can produce rich, parameterized operational views at speed.
AI-assisted (vibecoded) — describe the visualization or application logic in natural language; the Experience Assistant generates HTML, CSS, JavaScript, or D3.js code inside the secure Block framework. Data-savvy analysts become full-stack application deployers without a dedicated engineering team.
Full-code — write custom SQL, Python, JavaScript, or BASH directly. Any visualization library. Any interaction model. The full power of a browser runtime inside a governed, secure framework.
MCP-driven agent development — one of the most significant recent additions in 2026. The Zuar MCP server exposes Zuar's full platform API surface to AI coding assistants like Claude Code. This enables a build loop where an AI agent creates datasources, writes and updates queries, configures blocks, and assembles pages programmatically — iterating in real time based on natural language feedback from an analyst or consultant. The entire build is version-controllable, reproducible, and auditable through the API. An analytics team describing requirements to an AI assistant can go from raw operational data to a production-grade application in a fraction of the time any traditional development approach would require.
For professional services firms, this is the capability that changes the client relationship. Instead of delivering a Power BI report that a client's internal analyst could build themselves, a firm can deliver a custom operational application — built with AI assistance on Zuar Portal — that their client cannot replicate on any traditional BI platform. The differentiation is architectural.
What "Beyond BI" Looks Like: The Perioperative Command Center
The best way to understand what a Data Experience Platform delivers — compared to what a traditional BI tool delivers — is to look at a concrete example.
Zuar's OR Block-Time Yield & Capacity-Loss Command Center is a mockup of a production-grade perioperative analytics application built in Zuar Portal using the Zuar MCP server with Claude Code. It is not a dashboard. It is a self-contained application with seven coordinated views, a left navigation rail, and a complete cross-filter architecture.
What it does that a BI dashboard cannot: It renders hand-authored SVG floor plans of three perioperative facilities — walls, sterile core, door swings, PACU bays — where every OR is a clickable polygon connected to a live query layer. Click a room and every other view on the board filters to that room's data, while the room keeps its full context in a slide-over inspector that unpacks its 07:30–15:30 minute by minute. Seven heat overlays and a month scrubber let leadership watch the floor re-heat across six months of data. None of this is in any chart library. It is possible because a Zuar Portal block is a full HTML/CSS/JavaScript environment with access to Portal's query results, theme variables, and authentication layer.
What it does for the decision problem: An eleven-component capacity bridge decomposes every allocated prime-time minute into signed categories — surgical value, setup and turnover, punctuality losses, governance losses, structural idle time — with every component asserted in-database and re-verified in the browser. A utilization-versus-margin quadrant plots every block owner simultaneously, making visible the reallocation decisions that utilization metrics alone would get wrong. A three-definition utilization view eliminates the definitional disagreements that stall block committee meetings.
What it does for rapid deployment: The datasource is a single SQL statement with synthetic data inline. Point it at SELECT * FROM your_table, keep the field names, and every visual keeps working. A published field contract in the datasource header tells a client exactly which columns their production data must supply. Demo today, pilot on production data tomorrow — no rebuild, no re-engineering.
All data in the demo is synthetic - for fictional organizations created for demonstration purposes.
This is the proof-of-concept for any professional services firm or health system analytics team evaluating what Zuar DXP can build. The perioperative command center is one application in one operational domain. The same architecture applies to surgical scheduling, workforce capacity, patient flow, supply chain, and any other area where the operational picture is too complex for a standard chart library.
Why Professional Services Firms Should Be on Zuar DXP
For analytics and professional services firms serving healthcare clients — strategy consultancies, perioperative advisory firms, revenue cycle specialists, healthcare IT implementers — the platform choice determines the ceiling on what you can deliver.
A firm building on traditional BI is constrained by the chart library and the licensing model. A firm building on Zuar DXP is constrained only by what the browser can render — and by the analyst's ability to describe what they want to an AI coding assistant.
The practical advantages for professional services delivery:
White-label branding per client. Every portal delivered to a client can carry the firm's brand, the client's brand, or both — with full control over colors, fonts, logos, and navigation. No generic BI tool chrome visible to the client.
Block-level content security. Different client stakeholders see different content from the same portal deployment. A COO sees the full operational view; a service line director sees their scoped view; an external surgical group sees only their attributed cases. One deployment, governed by role.
Sample-to-production architecture. Build the application on synthetic data matching the client's schema. Hand the client the field contract. They connect their production data and the entire experience works immediately. Dramatically compresses the pilot-to-production timeline.
AI-assisted build speed. Using the Zuar MCP server with Claude Code, an analyst can build a production-grade operational application in days rather than weeks. For professional services engagements where time is billable and deliverable quality drives renewal, this is a material competitive advantage.
Embeddable BI preservation. Clients with existing Tableau, Power BI, or ThoughtSpot investments don't have to abandon them. Zuar Portal embeds existing BI tool outputs alongside native Portal content on the same page — preserving client investments while elevating the delivery container.
The firms that will differentiate in healthcare analytics over the next three to five years will not be delivering prettier Power BI reports. They will be delivering governed, branded, operational applications that look and function like software — because that is what Zuar DXP enables, and it is what traditional BI cannot match.
Governance, Security, and Multi-Audience Delivery
Healthcare is a compliance-sensitive environment. Any analytics platform serving hospital operations must handle security and governance at a level that clinical and legal stakeholders can stand behind.
Zuar DXP's governance model is enforced at the right layers:
Row Level Security at the connection level. Data access permissions are defined at the data source connection — not in a dashboard filter or a report parameter that can be overridden. No generated code, no AI-assisted block, and no custom JavaScript can bypass what is enforced at the connection. This is the architecture that makes agent-driven development safe: AI writes code inside a framework that cannot produce a data breach.
Single-tenant isolated instances. Every Zuar DXP deployment runs in its own environment — its own servers, its own database, its own network boundary. No shared infrastructure with other customers. For healthcare organizations where data residency and HIPAA compliance are non-negotiable, single-tenant isolation is the right architecture.
Block-level content visibility controls. Content blocks within a portal page are shown or hidden based on user role or attribute. A COO and a department director can be on the same page, seeing different content, without any engineering overhead per role.
SSO and IDP integration. Zuar Portal integrates with enterprise identity providers. User management, role assignment, and access governance flow through the organization's existing identity infrastructure — not a separate credential system.
The Platform Decision for Hospital Operations
Hospital COOs and the professional services firms that serve them are at an inflection point in analytics platform selection. The BI tools that have dominated the past decade were built for a different era — clean data, internal analysts, read-only reporting. Hospital operations in 2026 requires a platform that can model the full operational complexity of a health system, deliver governed applications to multiple audiences, trigger action rather than just display data, and enable AI-assisted development that turns analysts into application builders.
| Capability | Traditional BI | Zuar DXP |
|---|---|---|
| Custom operational application architecture | ❌ Chart library only | ✅ Full browser canvas |
| Multi-audience delivery with per-role security | ⚠️ Expensive licensing | ✅ Built-in, block-level |
| Data writeback to operational systems | ❌ Read-only | ✅ Native writeback |
| MCP / agent-driven development | ❌ No API surface | ✅ Zuar MCP + Claude Code |
| Workflow triggers from data events | ❌ Not in scope | ✅ Runner job triggers |
| White-label branding per audience | ❌ Limited | ✅ Full control |
| Sample-to-production swap architecture | ❌ Rebuild required | ✅ Single datasource swap |
| Embed existing BI investments | ❌ Vendor-siloed | ✅ Any tool, same page |
| Single-tenant isolated deployment | ⚠️ Varies | ✅ Standard |
The question is not whether Zuar DXP can do things traditional BI cannot. It demonstrably can. The question is whether your organization — or your clients' organizations — has moved past the dashboard era and is ready for an analytics platform that can build what operations actually requires.
Most BI tools give you a chart library and hope your question fits it. Zuar Portal gives you the browser.
Talk to Zuar
Whether you're a health system analytics team looking to build your next operational application, or a professional services firm looking to upgrade what you can deliver to clients, Zuar DXP provides the platform, the tools, and the services layer to get there.


Frequently Asked Questions
What is the best analytics platform for hospital operations?
Hospital operations requires an analytics platform that can build self-contained application experiences — not just dashboards — with custom visualization logic, multi-query coordination, data writeback, and governed multi-audience delivery. Zuar DXP is a Data Experience Platform that provides a full-canvas application layer (HTML, CSS, JavaScript inside a governed Block framework), MCP-driven agent development via Claude Code, built-in writeback and workflow integration, and single-tenant isolated deployments that meet healthcare security requirements. Traditional BI tools like Power BI and Tableau are read-only, chart-library-constrained visualization tools that cannot produce application-grade operational intelligence.
What is the difference between a BI tool and a data experience platform in healthcare?
A traditional BI tool answers "What happened?" with a chart library, a drag-and-drop builder, and a read-only data model. A Data Experience Platform (DXP) answers "What should we do about it, and can the platform help us do it?" — with writeback to data layers, workflow triggers, custom visualization and application logic, and governed multi-audience delivery. In healthcare, the difference shows up in whether your analytics layer can model the full operational picture (OR capacity, staffing, patient flow, financial performance) as an actionable application, or only as a static report.
How can professional services firms deliver better analytics to hospital clients?
Professional services firms serving healthcare operations can move from delivering BI reports to delivering governed, white-labeled, operational analytics applications by building on Zuar DXP. The platform's no-code-to-full-code development spectrum — including AI-assisted (vibecoded) block development and MCP-driven agent development via the Zuar MCP server — enables analysts to build custom operational applications without a dedicated front-end engineering team. White-label branding per client, block-level content security, and a sample-to-production datasource architecture compress the timeline from pilot to production.
What analytics tools do hospital COOs actually use?
Hospital COOs typically inherit a combination of EHR-embedded analytics (Epic Cogito, Oracle Health), generic BI tools (Power BI, Tableau), and point solutions for specific domains (OR scheduling, workforce management, costing). The gap most COOs report is not data availability — it's the ability to synthesize operational data across domains into a unified decision-support application that non-analyst leadership can use without training. Zuar DXP addresses this by combining data pipeline orchestration (Runner), a governed application layer (Portal), and a services organization (Zuar Labs) that delivers production-ready operational applications.
How do you build custom healthcare analytics applications without a large engineering team?
Zuar DXP's development spectrum enables data-savvy analysts to build production-grade custom healthcare applications through AI-assisted development. The Experience Assistant generates HTML, CSS, JavaScript, and D3.js visualizations from natural language descriptions inside a governed Block framework. For the full build loop — creating datasources, writing queries, building blocks, and configuring pages programmatically — the Zuar MCP server enables AI coding assistants like Claude Code to interact directly with the platform API. All AI-generated code runs inside Zuar's security framework, which enforces Row Level Security at the connection level regardless of what the AI produces.
What does an app-like healthcare analytics experience mean in practice?
An app-like data experience in healthcare analytics is a self-contained operational application — not a dashboard — with multiple coordinated views, navigation structure, cross-filter architecture, custom visualization logic, and context-aware interactions that would not be possible in a standard chart library. Zuar's perioperative command center is a concrete example: interactive SVG floor plans where each OR is a clickable polygon connected to a live query layer, a cross-filtering seven-view architecture with zero page reloads, custom capacity bridge waterfall logic, and a sample datasource that swaps to production data without rebuilding any of the application logic.
Is Zuar DXP HIPAA-compliant?
Zuar DXP's architecture is compatible for healthcare compliance requirements when the client IT team takes control: single-tenant isolated deployments hosted or on-premise (no shared infrastructure), Row Level Security enforced at the data connection level (not overridable by dashboard filters or generated code), SSO and IDP integration for enterprise identity management, and block-level content visibility controls per user role. Organizations should evaluate Zuar DXP against their specific HIPAA compliance requirements and engage Zuar's team directly.
