Key Takeaways
- BI initiatives have failed at a rate of 70–80% over the last decade, and field service operations businesses may have suffered more than most. When your operational truth is split across an FSM platform, a CMMS, an ERP, a dispatch tool, and a payroll system that only exports CSVs, a visualization layer was never going to be enough.
- Zuar DXP is built for the disparate data reality of field service: FSM platforms, CMMS tools, ERPs, homegrown dispatch systems, and every other data source your operation depends on—connected, modeled, and made analytics-ready by Zuar Runner.
- Zuar DXP goes far beyond drag-and-drop BI dashboards: AI-assisted construction, writeback, triggered workflows, and live data interactions turn static reports into operational tools that drive action in the field.
- One platform serves internal operations teams, external customer portals, and partner/vendor dashboards—with block-level content security, granular governance, and complete branding control per audience.
- Existing BI tools and legacy reports can be embedded into Zuar DXP immediately, ensuring a smooth transition on your timeline—not a forced rip-and-replace.
- Working with Zuar Labs ensures rapid deployment, high adoption, and continuous improvement from day one.
Why Field Service Operations BI Projects Fail Before the First Dashboard Gets Built
Field service operations is a data-intensive business. Technician utilization, first-time fix rates, SLA compliance, work order aging, route efficiency, parts inventory, preventive maintenance schedules, customer satisfaction scores, and revenue per technician—the operational picture is built from dozens of interconnected data streams, and those streams almost never live in the same system.
Most field service businesses have an FSM or CMMS platform at the core. But the data reality looks far more complex: job records in one system, billing and invoicing in another, parts and inventory in a third, dispatch notes and GPS tracking in a fourth, and payroll in a fifth. Regional branch spreadsheets fill the gaps. Legacy homegrown systems carry data that nobody has touched in years but everyone still needs. Vendor and subcontractor records add yet another layer.
Without a proper integration and analytics foundation, operations leaders spend their days reconciling numbers from fragmented sources instead of acting on them. Service managers build their own Excel exports. Dispatchers can't see technician capacity across regions in a single view. Executives receive weekly reports assembled by hand that are outdated the moment they're printed.
This is why the BI decision for a field service operations business is fundamentally different from a generic software comparison. The visualization layer is almost the last consideration. What matters first is whether your BI platform can reach your data—all of it, from every system—and whether it can turn that data into action.
The global BI market reached $41.16 billion in 2026, yet Gartner research shows that 70–80% of BI projects fail to deliver expected business value. In field service, those failures follow a predictable pattern: the demo looks great on clean sample data, but connecting to a real FSM platform, a legacy CMMS, or a homegrown dispatch system turns a Q1 rollout into a Q3 rescue project. The problem isn't budget. It's architecture.
FSM, CMMS, Dispatch, ERP: The Real Requirements for Field Service Operations BI
Before evaluating any platform, field service leaders should map what their analytics stack actually needs to do across the full operational picture:
Cross-System Technician and Workforce Visibility — Real-time utilization rates, capacity by region or crew, first-time fix performance, job completion rates, SLA attainment, and labor cost per job. This data lives across your FSM, scheduling, HR, and payroll systems—none of which talk to each other natively.
Work Order and Service Analytics — Backlog aging, work order cycle times, repeat service calls, and parts delay impact. Finance and operations need to see not just what the work order says, but how it ties to costs, contract terms, and customer history.
Route and Dispatch Efficiency — Geographic views of technician coverage, drive time, and response windows. Dispatch needs live visibility; operations leadership needs trend analysis over time.
SLA and Compliance Tracking — Contract-level SLA attainment, escalation triggers, and at-risk customer alerts—before the SLA is missed, not after the invoice dispute.
Preventive Maintenance and Asset Tracking — Scheduled vs. actual PM completion rates, asset failure trends, and equipment history across customer sites. This often pulls from a CMMS that has never been connected to anything else.
Customer and Partner-Facing Analytics — As field service businesses grow, customers increasingly expect self-service access to their own service history, asset status, open tickets, and spend summaries. Subcontractors and vendor partners need their own scoped views. Delivering that securely, at scale, and branded to your business requires far more than a standard BI tool with an embed license.
Writeback and Workflow Integration — Overdue work order alerts, low utilization warnings, contract renewal triggers, and parts shortage flags should not just populate a report. They should trigger action: routing alerts to the right team, firing a job sequence, escalating in your CRM, or updating a planning layer.
None of this is possible with a visualization tool bolted onto one data source. It requires a full-stack data experience foundation.
 Joel Stellner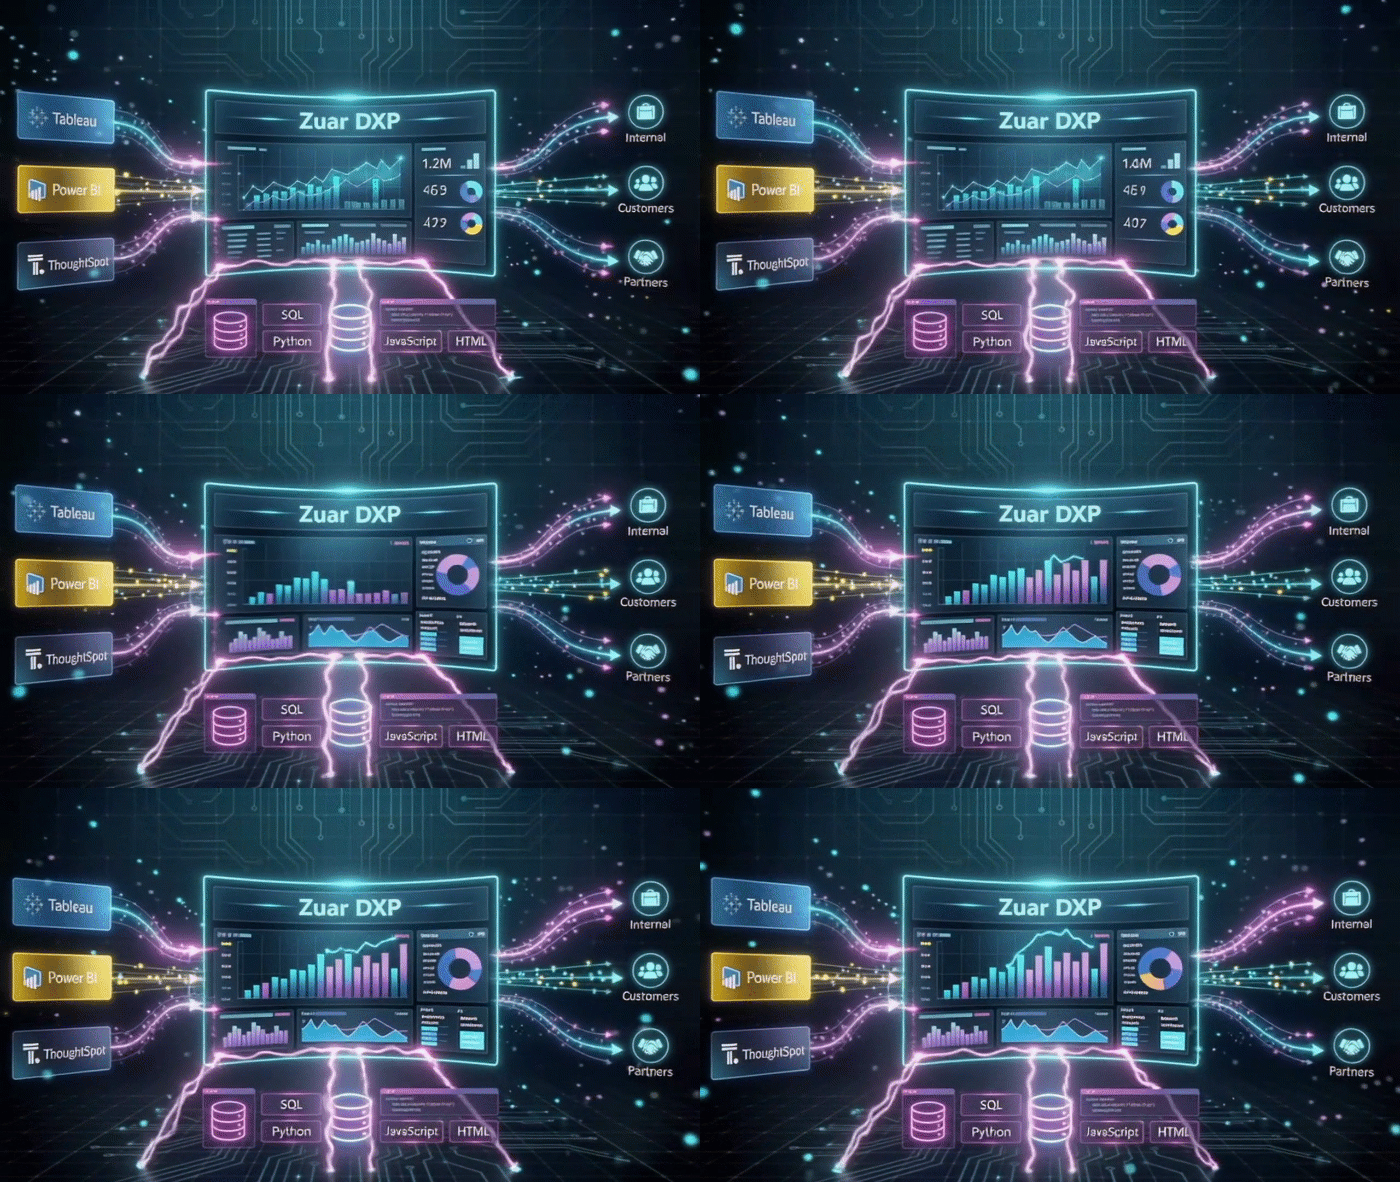
Why Power BI, Tableau, and Looker Keep Failing Field Service Operations Businesses
The platforms that have dominated the Gartner Magic Quadrant for the past decade—Power BI, Tableau, Looker, and their peers—were engineered around a premise that made sense in a different era: clean, structured data, analyzed by internal teams, delivered as a static report.
That is not field service operations. And the failure patterns are specific and consistent.
The integration wall hits immediately. A mid-sized HVAC contractor runs ServiceTitan for dispatch and work orders, a separate CMMS for preventive maintenance records, QuickBooks for billing, and a payroll platform that exports CSV files twice a month. When they deploy Power BI, they discover that connecting all four sources into a single coherent model requires ETL infrastructure that Power BI does not provide—it has to be built separately, maintained separately, and breaks every time a source system updates its schema. The Q1 rollout becomes a Q3 engineering project.
Dispatch and operations teams hit the read-only wall next. A regional manager can see on their Tableau dashboard that first-time fix rates in the Northeast territory have dropped 11 points over the past six weeks. What they cannot do from that dashboard: flag the affected accounts, push a supervisor review task to the dispatch queue, or trigger a follow-up inspection workflow. They screenshot the chart and send it in a Slack message. The action happens elsewhere, manually, asynchronously. The dashboard informed someone. It didn't change anything.
Customer portals require a separate project entirely. A commercial facilities management company wants to give their 200-plus enterprise accounts self-service access to their own open work orders, asset maintenance history, and SLA compliance reports. The honest answer from any traditional BI vendor: that requires OEM embedding licensing, a custom authentication layer, a multi-tenant data model, and a frontend framework to host it all in. Budget 6–12 months of engineering and a licensing cost that scales with every customer you onboard. Most companies abandon the effort or deliver PDF exports by email instead.
The data ecosystem keeps growing; the BI tool stays static. When a field service company acquires a regional competitor, they inherit a homegrown dispatch system built in 2011 that has never been integrated with anything. When they add a telematics platform for GPS tracking, it comes with its own data silo. Every new system either gets connected through a fragile point-to-point script or simply doesn't make it into the BI layer at all—leaving leadership with dashboards that are technically live but structurally incomplete.
These are not edge cases. They are the standard experience for field service organizations attempting to deploy traditional BI at scale.
The BI category is splitting in two. On one side: platforms optimized for standardized charts and analyst-facing exploration. On the other: Data Experience Platforms—unified layers that handle the full journey from complex, multi-source operational data to governed, branded, action-oriented analytics for every audience. Zuar DXP is built for the second category—and built specifically for the operational realities field service businesses live in every day.
If you operate in equipment rental—a structurally similar industry with its own mix of ERPs, telematics, and customer-facing analytics requirements—see our companion piece: Best BI Platform for Equipment Rental Businesses.
Zuar DXP: Built for the Data Reality of Field Service Operations
"Zuar is not just a BI vendor or a portal tool. Zuar is a full-stack Data Experience Platform (DXP) that unifies data pipelines, analytics delivery, embedded BI, AI analytics assistants, automation, writeback, and workflow integration in one governed framework."
Field service operations is one of the most data-hostile environments a BI platform can be asked to serve. Operational data is fragmented across FSM platforms, CMMS tools, ERPs, GPS systems, parts databases, and homegrown tools that were never designed to be integrated. Audiences range from dispatchers who need sub-second queue views to enterprise customers who need a self-service portal showing their own asset history. Decisions can't wait for a weekly report—they need to happen when a technician is still on-site or before an SLA window closes.
Zuar DXP was architected for exactly this environment. It handles the full journey: from raw data extraction out of the hardest-to-reach systems, through modeling and semantic alignment, to governed delivery across every audience—with AI assistance, workflow triggers, and branding control at every layer.
The platform operates as a unified whole across three interdependent layers:
- Zuar Runner — The data backbone: acquisition, ETL, modeling, orchestration, and custom backend jobs that make any field service data source analytics-ready, regardless of age, format, or API availability.
- Zuar Portal — The experience layer: branded frontend, embedded analytics hub, no-code to full-code application builder, and the governed interface for internal operations teams, external customer portals, and partner/vendor networks—all from one deployment.
- Zuar Labs — The outcomes layer: the services and customer success division that ensures rapid deployment, high adoption, and continuous improvement from day one—not just a license and a help center link.
 Joel Stellner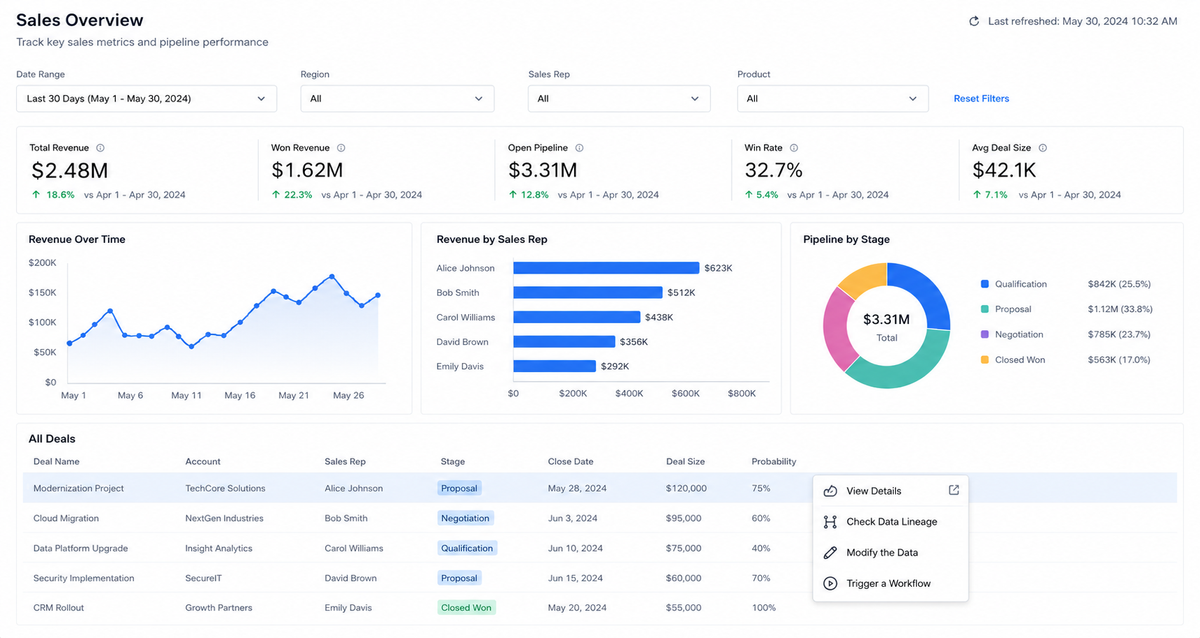
1. Runner: The ETL Engine Built for Field Service's Hardest Data Problems
Every field service BI project eventually hits the same wall: the data isn't where the BI tool can reach it. Zuar Runner was built specifically to tear down that wall.
Runner is not a connector library or a no-code ETL wizard. It is a full pipeline orchestration engine that handles acquisition, transformation, modeling, and scheduling across every category of data source field service businesses actually run—including the ones other platforms quietly skip over.
The field service data landscape Runner is designed for looks like this: an FSM platform (ServiceTitan, FieldEdge, ServiceMax, Salesforce Field Service, or a homegrown system built before those existed) handling dispatch and work orders; a separate CMMS managing preventive maintenance schedules and asset histories; an ERP or accounting platform holding billing, cost, and financial data; a parts and inventory system with its own schema and status codes; a payroll platform exporting CSVs on a bi-weekly schedule; and GPS or telematics feeds that were never designed to be analytically accessible. Most organizations have at least four of these. Many have all of them, plus a few more.
Runner connects to all of it. Here's what that means in practice:
Normalization across conflicting schemas. "Completed," "Closed," "Done," and "Resolved" may all mean the same thing across four different systems. Runner maps them to a single consistent status definition—so when a dashboard shows work order completion rates, it's counting the same thing everywhere, not producing four different numbers depending on which source a particular report pulls from.
Semantic alignment across technician, asset, and customer records. Technician IDs in the FSM don't match employee IDs in payroll. Asset records in the CMMS use manufacturer serial numbers; the FSM uses internal equipment tags. Customer accounts in the ERP use billing IDs; the FSM uses service account numbers. Runner builds the semantic layer that reconciles these identities into a single model—so reports on technician performance, asset history, and customer profitability are drawing from a unified source of truth, not three disconnected ones.
Custom job types for the systems that have no API. Legacy platforms, homegrown dispatch tools, and older CMMS applications often have no modern API surface. Runner's custom job framework supports SQL extraction against legacy databases, Python scripting for complex transformation logic, and BASH for system-level file handling—FTP drops, encrypted flat files, proprietary export formats. If the data exists somewhere and can be read, Runner can be configured to reach it.
Orchestration with dependencies and alerting. A field service data pipeline isn't a single job—it's a sequence: extract from five sources, normalize technician records, join against the asset hierarchy, materialize the SLA compliance table, then trigger the dashboard refresh. Runner orchestrates that sequence with dependency logic, retry handling, and alerting when something fails—so your analytics environment is self-maintaining, not a daily manual task for someone on your operations team.
Everything else in Zuar DXP—the dashboards, the portals, the AI, the workflows—runs on top of this data layer. Getting that layer right is the difference between a BI project that delivers and one that stalls indefinitely in data reconciliation.
2. AI-Built, Action-Triggered: What a Field Service Dashboard Can Actually Do in Zuar DXP
Traditional BI positions the dashboard as the end of the workflow. Zuar DXP positions the dashboard as the beginning of the workflow.
AI-Assisted Dashboard Construction
Zuar Portal's native AI-powered application builder and MCP tools can fully construct visualizations, layouts, and interactive components from natural language descriptions—within Portal's governed Block framework. A field service operations analyst can describe what they need: "Show me technician utilization by region for the past 30 days, with a drill-down to individual work orders"—and the AI builds it, following Portal's security model and data access controls automatically.
This is not vibecoding in a vacuum. It is governed AI-assisted development: every piece of AI-generated content runs within Portal's enterprise framework, with Row-Level Security enforced at the connection level, credential obfuscation at the platform level, and SSO operating at the portal level. The creativity is real. So is the governance.
A Development Spectrum for Every Team
Field service businesses have different team sizes and technical capabilities. Zuar DXP meets every team where they are:
- No-code drag-and-drop for operations managers and team leads who need dashboards fast, without engineering resources.
- Low-code template blocks with configurable parameters—SQL-driven visual components that can be customized without building from scratch.
- AI-assisted vibecoding for advanced custom visualizations: D3.js lineage diagrams, interactive Gantt-style dispatch views, multi-query coordinated operational dashboards.
- Full-code (HTML, CSS, JavaScript, Python, SQL, BASH) for the custom business logic that makes a field service dashboard genuinely operational rather than decorative.
This is what separates Zuar DXP from the "drag-and-drop wizard" category. The analytics capability available to your team is not constrained by what a proprietary visualization engine exposes through its UI. Zuar Portal's Blank Canvas block type gives your team the full power of the browser—Canvas API, custom interaction models, physics-driven visualizations if that is what the use case calls for—all within the same governed enterprise framework used by every other block on the page.
Dashboards That Trigger Action
For field service operations, analytics that only display data are not enough. Zuar DXP closes the loop between insight and action:
- Writeback — Users can push data from the analytics layer back into operational systems. A dispatcher can update assignment status, flag a missed SLA, or log a service note directly from a dashboard—and that action flows back to the source system.
- Triggered Jobs and Sequences — Runner jobs can be triggered from Portal events. A utilization threshold breach triggers an alert workflow to the regional manager. A PM completion rate dropping below target fires an escalation sequence. Analytics become the trigger, not just the readout.
- Data Curation and Classification — Dashboards can classify and curate data as part of user interaction: flagging high-risk accounts, categorizing work orders by root cause, or tagging assets for priority maintenance review.
These capabilities are not available in traditional BI tools. They require a platform built to treat analytics as an operational layer, not a reporting layer.
 Joel Stellner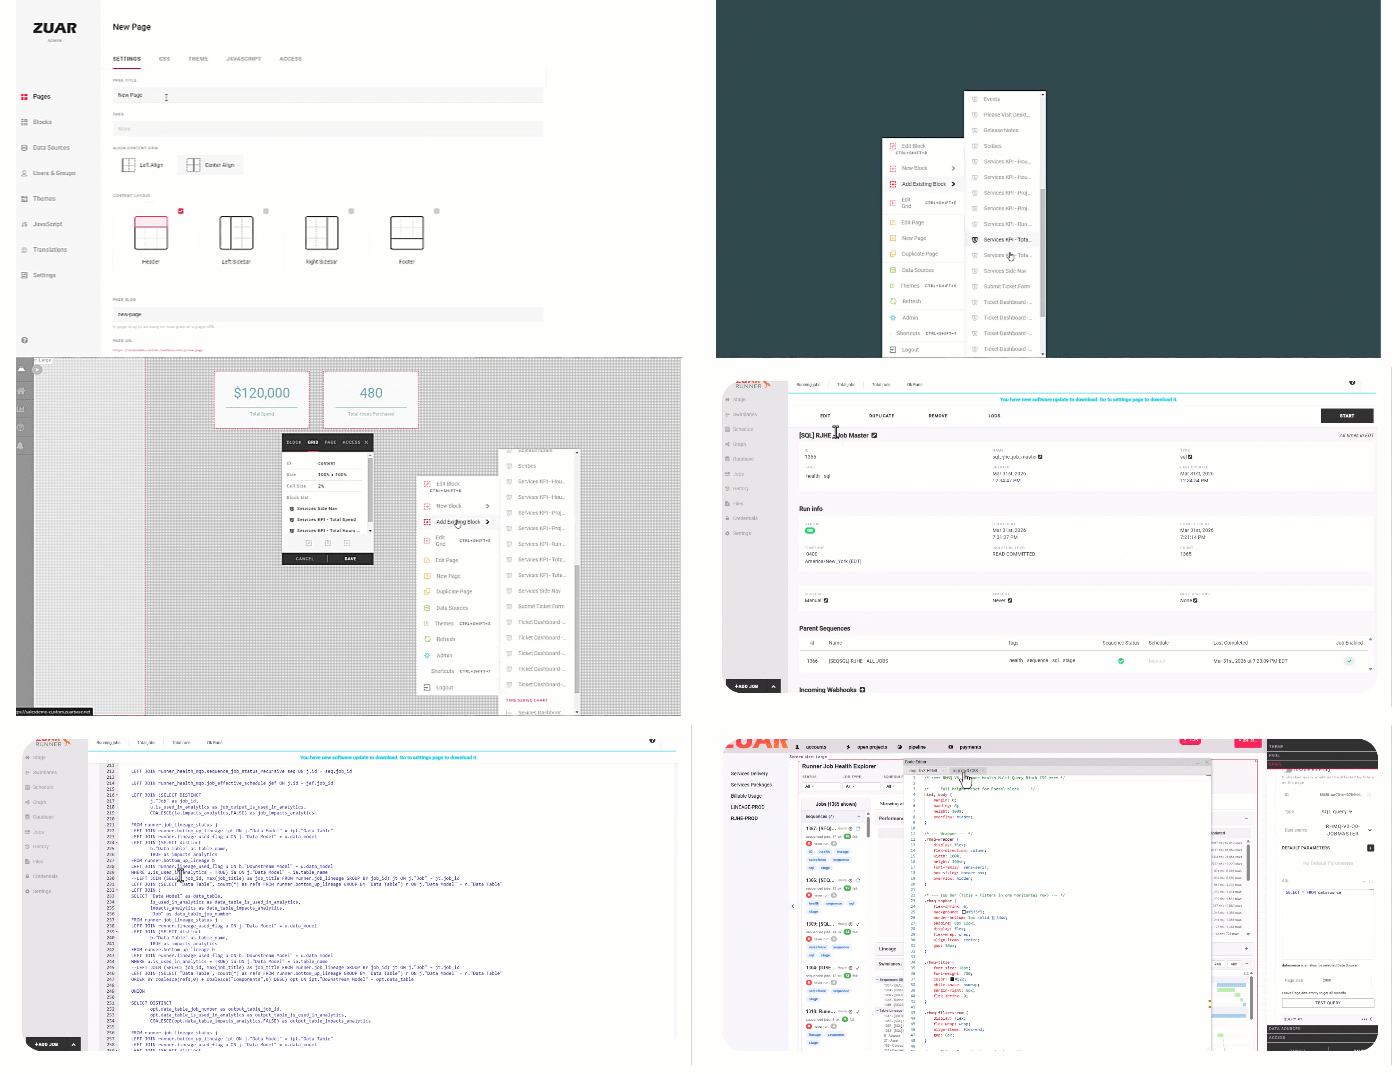
3. One Platform for Every Audience—Internal, Customer-Facing, and Partner/Vendor
Field service businesses serve multiple distinct audiences who need access to data in fundamentally different ways, with fundamentally different permission structures. Zuar DXP was designed to serve all of them from one governed platform—not three separate tools cobbled together.
Internal Operations and Leadership
Service operations managers, regional directors, dispatch teams, finance, HR, and executive leadership each need different views of the same underlying data. With Zuar DXP, internal dashboards are role-specific by default: the regional manager sees their region; the dispatcher sees today's queue; the CFO sees margin, utilization trends, and SLA attainment across the business. No spreadsheet reconciliation. No PDF exports. No manual version control.
Customer-Facing Analytics Portals
Your commercial customers increasingly expect self-service access to their own service data: open work orders, asset history, PM completion rates, billing summaries, and SLA performance against contracted terms. Delivering this in a branded portal—one that looks like your company, not a third-party BI tool—is a competitive differentiator. Zuar Portal is designed for exactly this. Customer portals inherit Row-Level Security enforced at the data connection level: no customer can see another customer's data, and no configuration mistake at the dashboard layer can override the connection-level restriction.
Partner and Vendor Portals
Subcontractors, equipment vendors, parts suppliers, and partner networks need their own scoped views: work order assignments, parts requisition status, payment summaries, or performance metrics tied to their service agreements. Zuar DXP handles this with the same platform, the same governed data pipeline, and the same security model—just a different audience definition.
Integrated Security and Governance at Every Layer
- Data source level — Row-Level Security is enforced at the connection, not the dashboard. It cannot be bypassed by dashboard configuration.
- Page and navigation level — Role-based access controls determine what each user group can see and navigate.
- Block level — Individual content blocks on a page can be shown, hidden, or conditionally rendered based on user role, attribute, or data context. A single portal page can show different content to a customer, a subcontractor, and an internal manager—simultaneously, with no custom engineering per user group.
- Single-tenant isolated instances — Every Zuar DXP deployment is its own environment. No shared infrastructure, no cross-tenant data risk.
Complete Branding Control and Variable Themes Per User Group
Zuar Portal offers true white-label control: custom URL, complete branding, and variable themes per user group. Your customer portal looks like your brand. Your partner portal can have a different look. Your internal operations hub uses your company's standard colors and design language. All from one platform, with zero configuration conflict between user groups.
4. Embed Existing BI Tools and Legacy FSM Reports—No Rip-and-Replace Required
One of the most common objections to any new analytics platform is the existing investment: years of Tableau dashboards, a Power BI environment that took 18 months to build, or legacy Crystal Reports that finance still depends on for weekly close.
Zuar DXP does not require a rip-and-replace. It is explicitly designed to work with—and around—your existing investments.
Embed and Unify on Day One
Zuar Portal can embed Tableau, Power BI, ThoughtSpot, and virtually any other BI tool directly into a unified, branded portal—on the same page if needed. A Zuar Portal page can show a Tableau dashboard alongside a native Zuar visualization alongside a legacy Crystal Reports export, all within a single governed, branded destination. Users see one experience. You maintain one security model. The transition happens at your pace, not at the pace of a replacement project.
Or Replace Immediately
For field service businesses ready to move entirely off legacy reporting, Zuar DXP's native dashboard and application capabilities are production-grade replacements for anything the traditional BI stack can produce—and they go significantly further. Native Zuar dashboards built with the full-code Block framework regularly outperform what is possible in a traditional drag-and-drop BI tool for complex, operationally integrated field service use cases.
The choice is yours. Zuar DXP accommodates both starting points, and every point in between.
5. Zuar Labs: The Analytics Team Most Field Service Businesses Don't Have—But Need
Here is the honest reality for most field service operations businesses: there is no BI team. There is a director of operations who exports things to Excel. There is an IT administrator who manages the FSM platform. There might be a part-time analyst who builds reports when they are not doing three other things. The idea of a dedicated data engineering function, a semantic modeling practice, a portal UX design team, and an AI adoption program is a Fortune 500 concept—not a field service company concept.
Zuar Labs was built for exactly this gap.
Zuar Labs is Zuar's services and customer success division, and it is the reason field service businesses are able to deploy a modern, production-grade analytics environment without hiring a full internal data team to do it. Instead of buying software and figuring it out yourself, you buy outcomes—and Zuar Labs delivers them.
What that looks like for a field service organization:
Zuar Labs starts with a structured data discovery engagement—auditing every system that holds operationally relevant data, mapping the relationships between them, and identifying the KPIs that matter most to your leadership, operations, and finance teams. This step alone eliminates months of internal scoping work that most companies either skip (and regret) or never complete (and then wonder why the dashboards don't match).
From there, the team builds the data models in Runner—the semantic layer that reconciles technician IDs across HR and FSM, asset records across CMMS and ERP, and customer accounts across every system that has its own naming convention. They build the Portal environments for each audience: the executive hub, the operations dispatch view, the customer portal, the subcontractor dashboard. They design the role-based security model, configure the themes per user group, and handle the governance setup that most BI implementations treat as an afterthought.
Then they train your team—not a one-day handoff, but structured enablement that ensures your operations managers, dispatchers, and executives actually use the platform. And they stay engaged through continuous improvement cycles as your business grows, your systems change, and your analytics needs evolve.
Packaged service offerings include:
- Data Experience as a Service
- Data Orchestration as a Service
- AI-Driven Analytics HQ Center of Excellence
- Zuar Labs AI Launchpad
The practical effect: a field service company with no internal BI resources gets the output of a mature data practice—modeled pipelines, governed portals, role-specific dashboards, customer-facing analytics, and ongoing improvement—without building the team internally. That is what makes Zuar Labs a decisive differentiator for this industry. The software alone is powerful. The software plus Zuar Labs is a complete analytics transformation.
The Decision Framework: Why Zuar DXP Is the Right BI Foundation for Field Service Operations
Choose Zuar DXP if:
- Your data lives across an FSM platform, CMMS, ERP, accounting system, dispatch tool, parts inventory, and branch-level spreadsheets.
- You serve more than one analytics audience: internal operations, external customers, or subcontractor/vendor portals.
- You need dashboards that trigger action—not just display data.
- You want to leverage AI in your analytics workflow without sacrificing governance or security.
- You have existing BI investments (Tableau, Power BI, legacy reports) that you want to preserve while modernizing.
- You want expert services that guarantee outcomes, not just software that opens a ticket.
Consider staying with a traditional BI tool if:
- Your audience is exclusively internal analysts and your data is already clean, structured, and centralized in one system.
- You have no customer-facing or partner-facing analytics requirements.
- Reporting is strictly read-only and no workflow integration is needed.
Very few field service operations businesses at scale fit that second description. If you serve multiple customers, manage multiple technicians across regions, and operate across more than two or three systems—you need more than a visualization layer.


Frequently Asked Questions
What is the best BI platform for field service operations businesses?
Zuar DXP is purpose-built for the data reality of field service: fragmented sources across FSM platforms, CMMS tools, ERPs, dispatch systems, and legacy databases, combined with the need to serve multiple distinct audiences—operations teams, executive leadership, external customers, and subcontractor networks. No traditional BI tool addresses that full picture. Zuar DXP handles it in a single governed framework, with Runner managing the data pipeline and Portal managing delivery and security for every audience.
How does Zuar Runner connect to FSM platforms and CMMS tools?
Runner connects to modern FSM platforms via API (including ServiceTitan, Salesforce Field Service, ServiceMax, and others), to relational databases for systems without an API layer, and to flat files and custom endpoints for legacy CMMS tools and homegrown systems. Once data is extracted, Runner normalizes status codes, reconciles technician and asset IDs across systems, and builds semantic models that power consistent KPI definitions across every dashboard—so "first-time fix rate" means the same thing everywhere, not something different depending on which system a report pulls from.
Can Zuar DXP deliver customer-facing portals for field service businesses?
Yes—and this is one of the most significant competitive advantages Zuar DXP provides in this industry. Commercial service customers increasingly expect self-service access to their own open work orders, asset maintenance history, SLA performance, and billing summaries. Zuar Portal delivers this in a fully branded, white-labeled environment with Row-Level Security enforced at the data connection level. No customer can see another customer's data, and the portal looks and feels like your company—not a third-party BI tool bolted onto your service agreement.
What KPIs does a Zuar DXP field service dashboard typically cover?
The core field service KPI layer typically includes first-time fix rate by technician and region, technician utilization and capacity, SLA compliance by tier and contract, work order backlog aging, preventive maintenance completion vs. schedule, response time performance, repeat service call rates, revenue per technician, and cost-to-serve by customer account. Zuar DXP surfaces all of these across role-specific views: executive summaries, operations and dispatch dashboards, customer-facing SLA and service history portals, and partner or vendor performance views.
Does Zuar DXP support writeback into field service operational systems?
Yes. Zuar Portal's Writeback capability lets dispatchers and operations managers push data from the analytics layer back into source systems without leaving the dashboard environment. Triggered jobs and sequences in Runner can be activated by Portal events—an SLA threshold breach fires an escalation workflow, a PM completion rate dropping below target generates a supervisor alert, or a technician performance flag routes to HR review automatically. This transforms the dashboard from a reporting tool into an operational one.
Can Zuar DXP embed our existing Power BI, Tableau, or legacy reports?
Yes. Zuar Portal embeds Tableau, Power BI, ThoughtSpot, and virtually any other BI tool directly into a unified, branded destination—including on the same page as native Zuar content. A field service company that has invested 18 months in a Power BI environment does not have to abandon that investment on day one. Zuar provides the governed, branded wrapper immediately, and the migration to native Zuar dashboards happens at whatever pace makes sense for the business.
What is Zuar Labs and how does it specifically help field service businesses?
Most field service companies do not have a dedicated BI team—and Zuar Labs is designed for exactly that reality. Zuar Labs operates as an extended analytics team: conducting the data discovery, building the Runner pipeline and semantic models across FSM and CMMS systems, designing the Portal environments for each audience (operations, executive, customer, partner), configuring role-based security and branding, training your team, and continuing to support the platform as your business evolves. Buyers get outcomes, not just software.
Does Zuar DXP support AI-assisted dashboard development for field service use cases?
Yes. Zuar Portal's Experience Assistant generates visualizations and dashboard components from natural language descriptions—within Portal's governed Block framework. An operations analyst can describe a technician utilization drill-down, a regional SLA compliance view, or a dispatch queue monitor in plain language, and the AI builds it while inheriting the platform's security model automatically. Zuar's Blank Canvas block also supports full AI-accelerated custom development using any standard web library, for operationally complex views that go beyond standard chart types.
How does Zuar DXP handle security across subcontractor and vendor portals?
Security operates at three independent layers: the data connection level (Row-Level Security that cannot be overridden by dashboard configuration), the page and navigation level (role-based access controls per user group), and the block level (individual content blocks conditionally rendered based on user role or attribute). A single portal page can serve an internal dispatcher, an external customer, and a subcontractor partner simultaneously—each seeing only the data and content defined for their role, with completely different branding and themes if needed.
Does Zuar DXP work for mid-market field service businesses, or is it only for large enterprises?
Zuar DXP is designed to scale from growing mid-market operators to large multi-branch service companies. Zuar Labs makes enterprise-grade analytics accessible to organizations without dedicated internal BI resources by functioning as an extended analytics team. For smaller field service businesses, this means a production-quality analytics environment—with connected pipelines, governed portals, customer-facing analytics, and ongoing support—without the headcount that would otherwise make it unreachable.
The Bottom Line
A field service operations business running four, six, or ten operational systems—some modern, some legacy, some homegrown—with technicians spread across regions, customers expecting self-service access to their own service data, and subcontractors who need their own scoped view, is not a business that a standard BI tool was built to serve. The demo will look fine. The integration project will not.
The last generation of BI leaders were built for a world where clean, structured data fed an internal analyst team producing weekly reports. That world still exists in some industries. It has never described field service at scale.
Zuar DXP was built for the world field service operations actually lives in. Runner reaches every system—the modern FSM, the decade-old CMMS, the homegrown dispatch tool that nobody has touched in years but everyone still depends on. Portal serves every audience—the dispatcher who needs this morning's queue, the CFO who needs margin by region, and the enterprise customer who needs their own SLA summary in your branded portal. The AI layer helps teams build faster. The writeback and workflow layer makes analytics operational. And Zuar Labs ensures it all gets deployed, adopted, and continuously improved—not just purchased.
If your field service operations business is ready to build its analytics on a foundation that matches the complexity of your actual data environment, Zuar DXP is that foundation.