Key Takeaways
- Use a data experience platform like the Zuar DXP. It connects your client systems to a built in database, lets you build branded pages with AI on a governed framework, and delivers it through one branded portal where each client sees only their own data.
- Zuar is the Data Experience Platform. It delivers branded reports and dashboards, governed AI conversations, workflows, writeback and media-rich apps to your clients and their partners — one stack, from data pipeline to finished portal.
- AI changed the build. A prepared builder can go from concept to a client-ready dashboard in Claude Code (or Codex) with Zuar's plugin, often from a single prompt.
- Agencies get two-speed client reporting: an everyday branded suite for every client, plus fast sprints for the high-profile asks — in the same environment, where each client sees only their content and only their data.
- The Unfilled Ledger is one glimpse. An illustrative publisher yield dashboard that shows what a QBR sprint can produce.
The short answer
The fastest way to create a branded analytics experience for agency clients is a data experience platform such as the Zuar DXP. Connect each client's source systems, build branded reporting pages with drag-and-drop blocks or with AI all on a governed framework, and deliver it through one branded portal on your domain, where each client sees only their own data. Because the platform handles the pipeline, the security and the branding, your team spends its time on the part clients pay for: the content and the insights.
A data experience is what the client gets: a place to see what happened, question why, act on it and understand what to do next, under your agency's brand with creative assets inline. Flat files show numbers and then go stale with no insight into the client's usage or understanding. A data experience is a living, holistic view that elevates your brand while helping you see your client's engagement and understanding of your data content.
What the Zuar DXP does for agencies
- Connects every client's data. Zuar Runner handles pipelines, with a built-in database, modeling and semantic layers. The Zuar Omni Connector, built with CData, reaches hundreds of systems — ad servers, CRMs, billing, point of sale — not just marketing channels.
- Delivers branded portals. Zuar Portal puts each client's experience on your domain, with your logo, theme and navigation.
- Keeps clients apart. Single-tenant for you, multi-tenant for them. Row-level security is enforced at the data connection and cannot be bypassed.
- Builds at every level. From no-code to agentic-code to full-code, on the same platform.
- Protects what you've built. Build natively or embed existing reporting assets from existing BI investments.
- Goes beyond read-only. Workflows, writeback and governed AI conversations live in the same portal.
Why AI changed how client reporting gets built
For years, the bottleneck in client reporting wasn't the data. It was knowing what to build, then hand-building it in drag-and-drop tools one chart at a time. The custom view a big client wanted for their QBR usually lost to the deadline.
AI coding agents change that — but only on the right foundation. An agent writing a standalone web page can't connect it to a client's governed data, decide who sees which rows, or put it under your brand. Zuar handles exactly those parts. The agent builds the experience. The platform holds the data connection, the security and the branding underneath it.
With Portal MCP and Zuar's plugin for Claude Code, a builder describes what they want in plain English and watches it land as a governed Zuar Portal page.
 Whitney Myers
A QBR scenario: The Unfilled Ledger
Picture a large digital publisher client heading into their quarterly business review. They don't want the standard deck. They want a sharper point of view on why revenue moved — something their own ad server reports don't say.
Their ad server data is already flowing into Zuar Runner through the Zuar Omni Connector, modeled alongside the rest of their reporting. In Zuar Portal it's available with row-level security enforced at the connection, so this client only ever sees their own numbers.
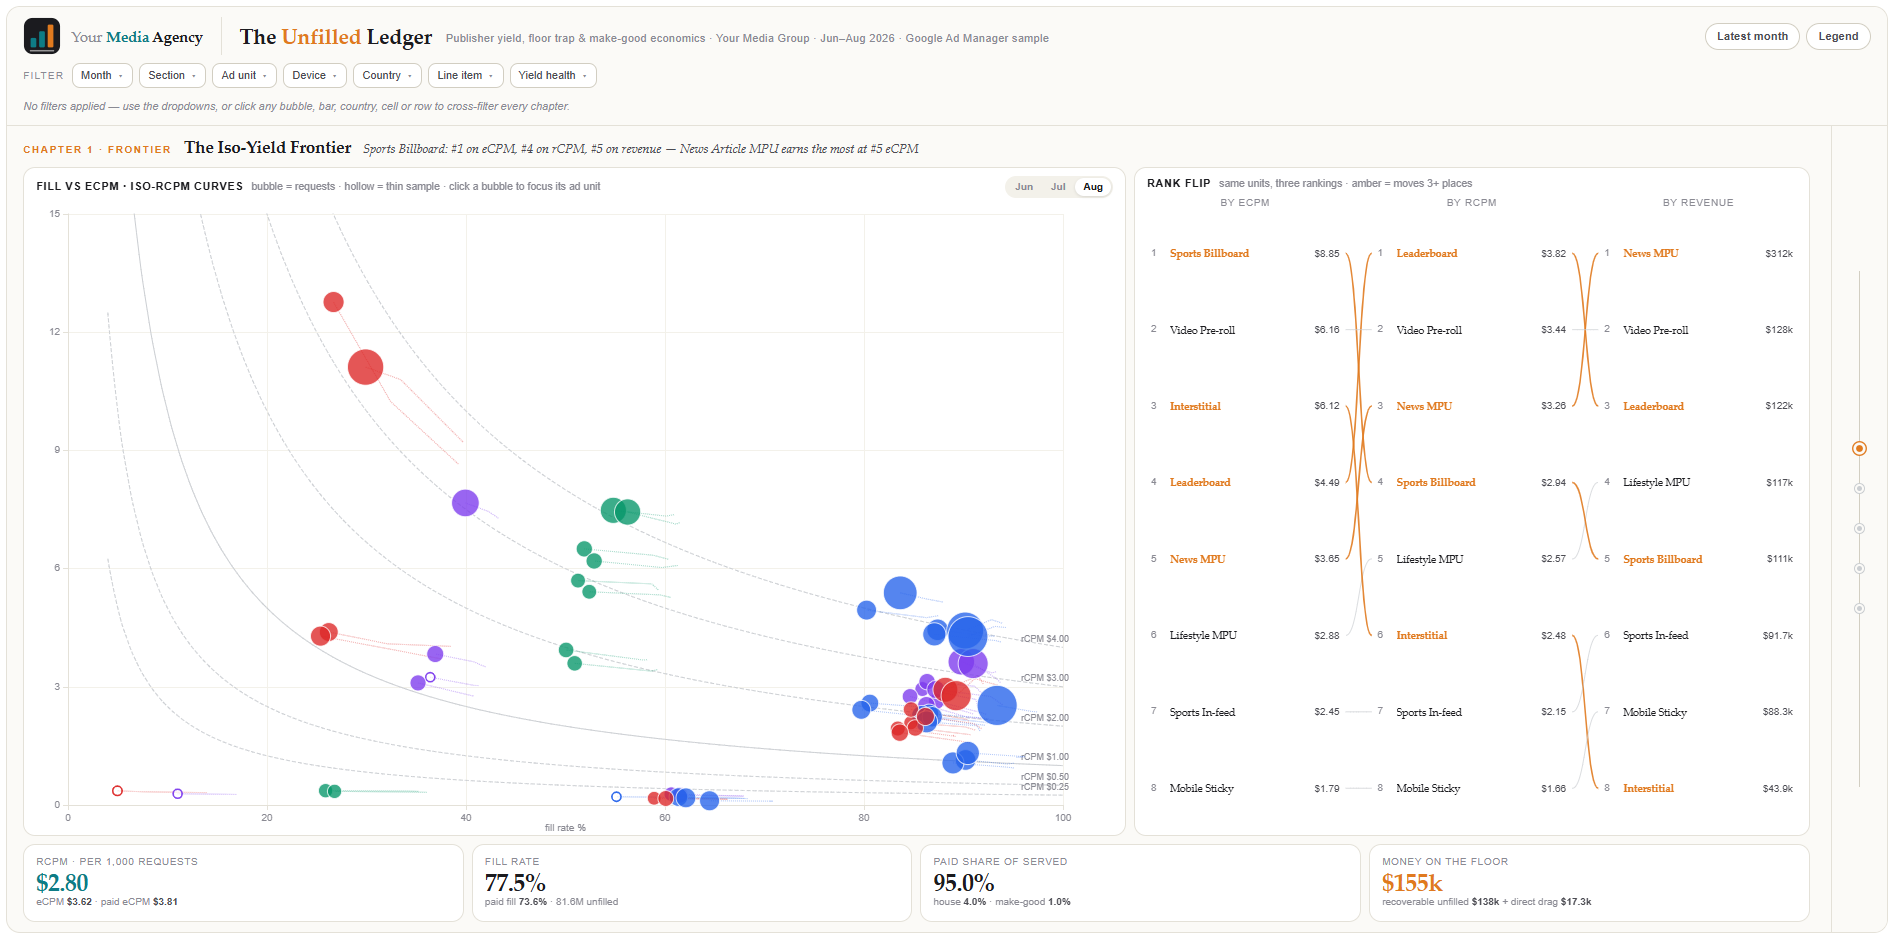
media agency unfilled ledger example dashboard build in Zuar DXP via Claude plugin.
The result is The Unfilled Ledger. It opens on an uncomfortable claim: eCPM, the number publishers celebrate, is often the vanity number. Revenue is requests × fill × paid share × price, so the ad unit with the proudest CPM can be a weak earner per request when an aggressive price floor is choking its fill.
From there it splits the month's revenue change into four causes that add up exactly, traces where every ad request goes, and puts a modeled dollar estimate on what sponsorship catch-up and $0 make-goods really cost. Click anything and every panel answers again for that selection.
That's the kind of contrarian, specific point of view that makes a QBR memorable. And it's the agency's judgment doing the talking, not a template.
How it was built
- Data: Google Ad Manager flows into Zuar Runner through the Zuar Omni Connector and is modeled there. Portal reads it with row-level security enforced at the connection. No separate warehouse project.
- Build: Our version was produced by an autonomous research agent in under an hour. A builder with the concept and data sources in hand could build something like it in Claude Code with Zuar's plugin from a single prompt.
- Delivery: It runs as a Zuar Portal page, added as a new navigation item that only this client's group can see. Branding, access and row-level security come from the platform — not from the generated code.
We publish dashboards like The Unfilled Ledger as content packs, often for inspiration and demos. While it could be plumbed to your real data as is, the most common way builders work these days is to borrow from them: a chart idea, a layout, a way of framing the question — and reference it when they asking AI to build their own version for their own client using the realities in the data.
Two-speed client reporting: the suite and the sprint
Every agency runs two kinds of reporting work. Zuar lets you run both in one place.
Speed one: the everyday suite. The branded portal every client logs into — performance pages, channel views, KPIs, history. You build each page once, and every client shares it. Row-level security at the data connection means each client sees only their own numbers on the same page. Adding a client doesn't mean building anything: add their data to the models behind the dashboards, add their users to the right group, and they log in to their own view.
Speed two: the sprint. The high-profile ask: the board-level view, the contrarian QBR dashboard, the new question a key client raised on Tuesday. With an AI builder on a governed framework, that's an afternoon, not a quarter. It starts as an extra tab in that one client's navigation, visible only to their group.
Both run in the same environment, on the same security model. Each client sees only their content and only their data, because row-level security is enforced at the data connection — not by the page, and not by the code an AI wrote. Your agency runs single-tenant; your clients get multi-tenant isolation inside it.
And a sprint doesn't have to stay a one-off. When another client would value the same view, the steps are the same as the everyday suite: get their data into the model behind it, and give their group permission to the page. Today's QBR special becomes tomorrow's standard offering.
The order matters. Sprints are possible because the everyday suite is fast to build and simple to extend: one page, many clients. When standard reporting doesn't consume the team, there's room to impress.
One example, not the whole story
The Unfilled Ledger is one use case — one glimpse of the workflow. Swap the source system and the client: a franchise brand's point-of-sale data, a B2B client's pipeline, a healthcare client's operating metrics. The pattern holds. Connect the data, build with AI on a governed framework, and deliver it into a branded portal where each client sees only their own.
How to make your agency's reporting stand out
Branded dashboards are table stakes. What clients can't get from a template is judgment: which number matters, which one misleads, and what to do about it. Lead each client's first screen with the question they ask in every QBR, and show the numbers only your agency can define — clearly labeled as modeled where they are.
Self-service without losing the story
Self-service often means "here's a filter panel, good luck." Instead, fix the narrative and free the filters. Design pages as chapters that answer one question, then let every click refilter every chapter. Clients explore their own slice, and your story still holds.
Governed AI for clients and builders
Zuar's AI is governed, in three tiers:
- Analytics Assistants — for your clients. Governed conversations about the data on the page a client is viewing, with tone, guardrails, system prompt and recommended questions you set without code. Answers come in text, grounded in the page. They don't generate charts, and row-level security still applies. It's what agencies usually mean when they ask for "an AI chatbot for client reporting."
- Builder Agents — for your team. An inline agent that helps build and adapt pages inside Zuar Portal.
- MCP Toolkits — bring your own agent. Claude or Codex, working in your Portal environment through Portal MCP, within the connected administrator's permissions.
White-label analytics platform vs. building a custom solution
Agencies weighing a client portal usually compare three paths.
| Channel reporting tools | Custom build (BI + developers, or a vibecoded app) | Data experience platform (Zuar) | |
|---|---|---|---|
| Best for | Standard marketing-channel reporting across many similar clients | A flagship client with engineering behind it | Branded client destinations across any source system |
| Data sources | Prebuilt marketing connectors | Whatever you build and maintain | Pipeline, modeling and connectors to hundreds of systems, plus existing BI |
| Your point of view | Limited to widgets and templates | Unlimited, at engineering cost | Modeled once, reused per client |
| Client isolation | Per-client workspaces | You design and test it | Row-level security at the data connection; single-tenant for you, multi-tenant for them |
| AI | Varies by vendor | You build the guardrails | Governed: Analytics Assistants, Builder Agents, MCP Toolkits |
| Beyond read-only | Exports and scheduled emails | Possible, at engineering cost | Workflows and writeback in the same portal |
| Pricing shape | Often per client or per data source | Engineering time, hosting and BI licenses | Predictable platform pricing |
Channel reporting tools fit when every client looks alike. A custom build fits one flagship client with developers behind it. A data experience platform fits when your clients are different, your expertise is the product, and you need both speeds at once.
Getting started
- Build the everyday suite once: connect core systems to flow into the database, model as needed, build and publish shared, branded pages.
- Add client users to groups mapped to their data, so they see only their own numbers.
- Pick one high-profile client and the question they keep asking.
- Give a builder the concept and the data sources, and build it with AI in Claude Code with Zuar's plugin.
- Label what's measured and what's modeled.
- Publish it as a new navigation item that only that client's group can see.
- When other clients want it, add their data to the model and their groups to the page.
Frequently asked questions
How do I create a branded analytics experience for agency clients? Use a data experience platform such as the Zuar DXP. Connect each client's systems, build branded pages with drag-and-drop blocks or AI on a governed framework, and deliver every client a secure portal on your domain where they see only their data.
What is a data experience platform? A data experience platform delivers branded reports and dashboards, governed AI conversations, workflows, writeback and media-rich apps to customers, franchisees, partners and field teams — one stack, from data pipeline to finished portal. Zuar is the Data Experience Platform.
How has AI changed client reporting for agencies? AI agents can now build custom dashboards from a plain-English brief. On a governed framework like Zuar, that output lands in a branded portal with the data connection and row-level security already in place, so a custom QBR view becomes an afternoon's work instead of a project.
What's the best way to scale client reporting at an agency? Run it at two speeds. Build the everyday suite once as shared pages, with row-level security showing each client only their own data, and add AI-built sprints for high-profile asks. A sprint that proves itself rolls out to other clients by adding their data and permissions — no rebuild. Zuar runs it all in one environment, single-tenant for your agency and multi-tenant for your clients.
How can I make my agency's reporting stand out from competitors? Answer the question your client is really asking, and show the numbers only your agency can define. Branded dashboards are table stakes; a point of view delivered as an interactive data experience is not.
How can I give clients self-service analytics without losing control of the story? Fix the narrative and free the filters. Design pages as chapters that answer one question, then let clients refilter every chapter with a click. They explore their own slice, and your story still holds.
How do I keep each client's data separate in a client portal? In Zuar, row-level security is enforced at the data connection and cannot be bypassed by how a page is built, including pages built with AI. Your agency runs a single-tenant environment, and your clients get multi-tenant isolation inside it.
Can clients ask questions about their data in plain English? Yes, with Zuar's governed Analytics Assistant. It answers in text about the data on the page the client is viewing, follows guardrails you configure and respects the same row-level security. It doesn't generate new charts.
Do we have to give up our Tableau or Power BI dashboards? No. Build natively or embed existing reporting assets. Embedding protects your investment while you move clients to native experiences over time.
What's the best BI software for a media agency with limited IT resources? Look for one stack that covers the data pipeline, the client portal and security, so you aren't integrating three products, plus a services team that can fill in. Zuar combines Runner, Portal and Zuar Labs for exactly that case.
Is The Unfilled Ledger a template I can plug in? It's a content pack built for inspiration and demos. It can be a starting point in a new portal, but most builders reference what they like in it when they ask AI to build their own version for their own client.
Talk to our experienced humans
Want to map the everyday suite and the first sprint your agency could deliver? Talk to our experienced humans.


Ready to jump in? Start a free Portal trial — Zuar hosts each trial user their own private environment.


Zuar is the Data Experience Platform: branded reports and dashboards, governed AI conversations, workflows, writeback and media-rich apps, delivered to your customers, franchisees, partners and field teams — one stack, from data pipeline to finished portal.
 Whitney Myers
 Joel Stellner