
Short answer: The best modern data stack for a small business is the smallest architecture that can reliably connect its source systems, define consistent business metrics, and deliver governed reporting to all audiences (internal and external) from one place. Companies without a data team will usually benefit from a managed end-to-end platform. Companies with technical ownership may prefer a modular stack with separate ingestion, storage, transformation, and business intelligence tools.
This guide covers both paths small businesses commonly face:
- Starting from scratch: You rely on Excel, Google Sheets, reports exported from business applications, or disconnected dashboards.
- Migrating an existing stack: You already use Power BI, Tableau, Looker, or another analytics platform but need to reduce complexity, improve governance, support external users, or modernize delivery.
Rather than presenting another generic list of dashboard tools, this guide compares three practical data-stack architectures and explains the implementation and migration work each one requires.
Disclosure: Zuar publishes this guide and provides a Data Experience Platform (DXP), data integration, modeling and semantic engineering, automation, internal data HQs, branded customer facing portals, bundled implementation services and full-spectrum ongoing success packages like the 'AI center of excellence'. Competitor capabilities and published prices were reviewed using vendor documentation linked throughout this article. Product availability, licensing, and pricing can change; verify the configuration that applies to your organization.
What Is a Modern Data Stack for a Small Business?
A modern data stack is the set of tools and processes a company uses to move data from operational systems into trusted reports, dashboards, AI applications, and business workflows.
A complete stack can include:
A small business does not necessarily need a separate product for every layer. In fact, buying seven specialized tools can create more operational work than value when nobody owns the integrations between them.
The objective is not to assemble the largest or most fashionable stack. It is to build the smallest dependable system that supports the decisions the business needs to make.
Three Practical Modern Data Stacks for Small Businesses
1. Lightweight Reporting Stack
Typical architecture: Business applications and spreadsheets → native connectors or a small database → Looker Studio or Power BI
Best for: A company with a few well-understood data sources, internal reporting needs, and relatively simple security requirements.
Advantages:
- Low initial software cost
- Fast experimentation
- Familiar tools for spreadsheet-oriented teams
- Limited infrastructure to administer
Tradeoffs:
- Important calculations may become duplicated across reports
- Spreadsheet-based preparation can be fragile
- Governance becomes harder as reports and users multiply
- Customer-facing or multi-tenant analytics may require a different architecture
This is often the correct starting point for a small business that needs five trusted KPIs—not a company-wide data platform. The key is to document metric definitions and assign an owner before the initial dashboards multiply.
2. Managed End-to-End Data Stack
Typical architecture: Business applications → managed ingestion, storage, and modeling → governed analytics portal or application
Best for: A company without a dedicated data team, a company combining several operational systems, or a business that needs secure reporting for customers, partners, franchises, or locations.
Advantages:
- Fewer vendors and integration boundaries
- One party can own implementation across the stack
- Faster access to specialized data and analytics expertise
- A consistent security and delivery model
Tradeoffs:
- Less freedom to replace each component independently
- Buyers must evaluate the provider's services capacity as well as its software
- Pricing and scope may require a tailored quote
Zuar Runner and Zuar Portal fit this architecture. Runner automates data acquisition and transformation, while Portal delivers internal analytics, branded portals, embedded BI content, and custom data applications. Zuar Labs provides implementation, data modeling, migration, design, and enablement services.
Note that Zuar Runner has a built in database, but can also use any other existing or future database as both a target and destination. Zuar Portal can also embed and consolidate existing BI investments instead of replacing them immediately. For example, a company can embed existing Tableau, Power BI, or ThoughtSpot content in a branded Portal while modernizing data pipelines, curating content organization and discovery, extending cross-system functionality, and improving or recreating selected experiences over time.
Note: Zuar Runner and Zuar Portal are the back and front end modules of the Zuar Data Experience Platform (Zuar DXP) and ship together by default.
Learn more about the rising 'Data Experience Platform' category:
 Joel Stellner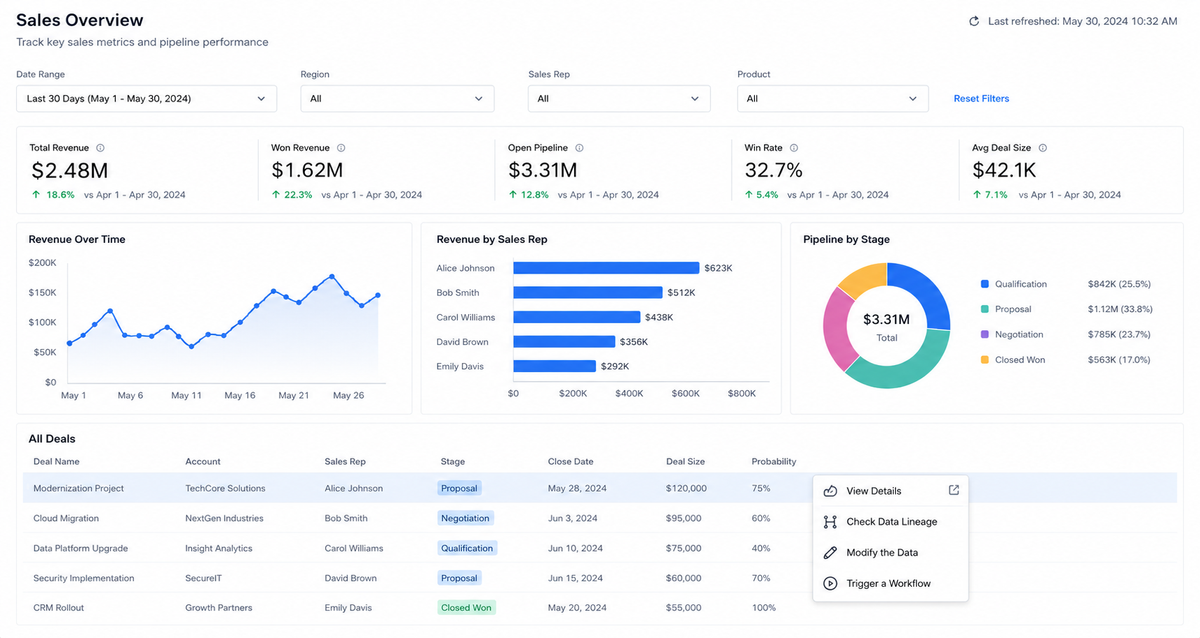
3. Modular, Warehouse-Centered Stack
Typical architecture: Airbyte or Fivetran → cloud warehouse → dbt or SQL models → Power BI, Tableau, Looker, or Metabase
Best for: A business with SQL or data-engineering ownership and a strategic reason to select each component independently.
Advantages:
- Component-level control
- Broad ecosystem of specialized products
- Portability when business logic is kept in the warehouse
- Ability to optimize individual layers for unusual requirements
Tradeoffs:
- Multiple contracts and pricing models
- More monitoring, testing, and incident ownership
- Higher dependence on internal technical knowledge
- Failures can cross vendor boundaries
For example, Fivetran uses usage-based pricing measured through Monthly Active Rows, while the warehouse may bill for storage and compute and the BI layer may bill by users or capacity. A modular stack can be cost-effective, but the company must model the total architecture rather than comparing one product's entry price with another platform's complete price.
What Should a Small Business Evaluate?
1. The first decisions the stack must improve
Start with three to five recurring business decisions—not a catalog of desired dashboards. Examples include:
- Which customers require intervention this week?
- Which products, locations, or projects are becoming less profitable?
- Is revenue performance caused by demand, conversion, capacity, or retention?
- Where is operational work falling behind its service commitment?
These decisions define the first metrics, data sources, update frequency, and audience.
2. Technical ownership
A modular stack can be an excellent choice when somebody owns SQL models, pipeline monitoring, permissions, upgrades, and cost management. Without that ownership, a collection of individually attractive tools can become an unmanaged production system.
Companies without internal data engineering should compare managed software, vendor-delivered implementation, certified partners, and ongoing support—not only feature lists.
3. Total cost of ownership
Data-stack pricing can be based on named users, viewer capacity, credits, data volume, Monthly Active Rows, connectors, query activity, storage, compute, or negotiated contracts.
Ask every vendor to price the same scenario:
- Number of dashboard builders
- Number of internal viewers
- Number of external users or customer tenants
- Data sources and refresh frequency
- Expected data volume
- Development, test, and production environments
- Row-level security and SSO
- Embedded or white-label delivery
- Implementation, training, and ongoing support
4. Governance and security
Governance is not an enterprise-only concern. A small business still needs to know:
- Who owns each important metric?
- Which source is authoritative?
- Who can see customer, employee, or financial data?
- How are permissions tested?
- Who receives an alert when a pipeline fails?
- Can a dashboard result be traced back to its source and calculation?
Row-level security matters when different users must receive different subsets of data from the same report. It may be unnecessary for a small, single-audience dashboard, but it becomes critical in multi-location, departmental, franchise, partner, and customer-facing applications.
5. The complete delivery experience
Internal dashboarding and customer-facing analytics are different requirements. External delivery may involve tenant isolation, authentication, branding, navigation, mobile behavior, support content, exports, workflow actions, and writeback—not simply embedding a chart in an iframe.
If external analytics may become part of the product or service, include that requirement in the original architecture decision.
Platforms Small Businesses Commonly Evaluate
The following products do not all perform the same role. Some are primarily BI layers; others include ingestion, transformation, storage, application delivery, or services.
Capabilities and pricing models reviewed August 17, 2026. Verify current vendor terms before purchasing.
Zuar
Zuar's Data Experience Platform (DXP) combines managed data integration and preparation through Runner, analytics and application delivery through Portal, and implementation services through Zuar Labs.
Portal supports drag-and-drop building as well as customization with HTML, CSS, JavaScript, and SQL-driven components. It can deliver native visualizations or organize and extend existing BI content inside a branded, governed experience. This makes Zuar particularly relevant when the desired outcome is more than an internal dashboard—for example, a customer portal, analytics product, operational workflow, or unified destination for multiple BI systems.
Zuar also describes conversational analytics, MCP integrations, and AI-assisted building capabilities. Buyers should confirm whether each desired capability is generally available, in preview, or part of a scoped implementation, and should test representative data, dashboards, calculations, and permissions during evaluation.
Best fit: Organizations seeking a customizable, future-proof analytics delivery stack that can serve internal and external audiences with ease under a predictable platform based model, can be enriched by media and other web content, has native AI agents for end user consumers, has native agents + AI optimized surfaces for builders and custom agentic workflow integrations, allows for branded customer facing analytics, provides rapid or a gradual paths away from an existing BI platforms, offers managed end-to-end implementation and has ongoing success and support packages delivered by in-house experts.
May not be the best fit: A company that only needs a handful of simple internal KPI charts and can satisfy the requirement with a free or entry-level reporting product and manual data capture, modeling and refresh.
Microsoft Power BI
Power BI is a natural candidate for companies centered on Excel, Teams, Azure, or Microsoft Fabric. Power BI Desktop is available as a free authoring application, while sharing and advanced capabilities depend on the service license and capacity configuration.
Microsoft currently lists Power BI Pro at $14 per user per month and Premium Per User at $24 per user per month, paid yearly. Pro may also be included in certain Microsoft 365 or Office 365 E5 subscriptions. Individual licenses are not the only distribution model: qualifying Fabric or Premium capacity can allow viewers to consume reports without separate paid per-user licenses.
Power BI also supports customer-facing embedded analytics. In Microsoft's “app owns data” model, external users do not need to sign in to Power BI or hold individual Power BI licenses. However, the company must implement the application, authentication, capacity, embed-token, and security architecture. Microsoft documents this customer-embedding model directly.
Best fit: Microsoft-centered organizations that want capable internal BI or already plan to use Fabric.
Migration consideration: DAX measures, Power Query logic, dataflows, semantic models, refresh schedules, workspace permissions, and embedded applications require explicit inventory and mapping.
Looker Studio and Looker
These are separate Google products with materially different use cases.
Looker Studio is a lightweight reporting product with native and partner connectors. It is useful for straightforward reporting from Google Sheets, Google Analytics, BigQuery, and supported external sources. Some source systems may require a paid partner connector or an intermediate database.
Looker Studio can support some user-specific filtering patterns, but organizations should validate whether those patterns meet their governance, row-level security, and tenant-isolation requirements.
Full Looker is a governed BI platform centered on LookML semantic modeling. It is strongest when a team needs reusable, version-controlled definitions for dimensions and measures across many reports. That consistency requires someone to own the LookML model.
Google describes Looker pricing as platform pricing plus user licensing. Its Standard, Enterprise, and Embed platform editions require a sales conversation rather than offering a universal public per-user starting price.
Best fit: Looker Studio for lightweight reporting; full Looker for warehouse-centered teams with a defined semantic-modeling requirement.
Migration consideration: Moving to full Looker is a modeling project, not merely a visual dashboard conversion. Existing calculations must be translated into governed LookML definitions.
Tableau
Tableau remains a strong platform for interactive visual exploration, calculated analysis, and analyst-led dashboard development. It supports live connections, extracts, data preparation, embedded analytics, and several licensing approaches.
Tableau's public pricing page lists offerings starting at $15 per user per month, billed annually, but that starting figure should not be treated as the price of every authoring role or deployment. Tableau also offers role-based licensing and capacity- or usage-based alternatives for some viewer and embedded scenarios.
Extracts are not inherently a problem; they can improve performance and portability. But an extract-heavy environment can accumulate refresh schedules, local dependencies, duplicated transformation logic, and ownership gaps. Those dependencies should be inventoried before migration.
Best fit: Analyst-heavy teams that value visual exploration or organizations with an established Tableau practice.
Migration consideration: Inventory workbooks, published data sources, extracts, calculations, parameters, extensions, permissions, subscriptions, and actual usage before deciding what to recreate.
Metabase
Metabase offers a free open-source edition, managed cloud plans, and paid governance and embedding capabilities. Its visual query builder can make database reporting accessible to users who do not write SQL, while technical users can work directly in SQL.
Metabase currently lists Pro at $575 per month on monthly billing, including the first 10 users, with additional-user charges. Pro includes row- and column-level permissions, multi-tenant embedded analytics, and white-label capabilities. Metabase also advertises professional services for setup, training, data-stack work, embedding, and modeling.
The open-source edition can be an economical choice, but self-hosting means the customer owns the production application database, backups, upgrades, monitoring, and security. Metabase recommends Docker for self-hosting but can also run from its Java JAR.
Best fit: Technical small businesses seeking an approachable open-source BI product or teams that find the paid embedding model suitable.
Zoho Analytics
Zoho Analytics is a natural option for companies already using Zoho CRM, Books, Desk, or other Zoho applications. It also connects to external business applications, files, databases, and cloud services.
Zoho's pricing varies by plan, users, and row capacity. Buyers should model all three rather than comparing only the advertised entry price. Zoho also offers embedded and white-label analytics, but those requirements should be quoted separately from ordinary internal BI usage.
Best fit: Zoho-centered organizations, agencies, and SMBs that want packaged analytics with relatively broad connectivity.
Domo
Domo combines data connectors, transformation, visualization, applications, mobile analytics, and embedded delivery within a broad cloud platform. Domo states that it provides more than 1,000 pre-built connectors.
Domo does not publish one standard price for every deployment. It currently describes a credit-based consumption model. For one ingestion example, credits are associated with tables created or refreshed rather than simply the number of rows transferred.
Buyers should ask Domo to model their actual ingestion jobs, refreshes, queries, storage, users, and other credit-consuming activities. The relevant question is not whether consumption pricing is inherently good or bad, but whether usage can be forecast and monitored reliably.
Best fit: Organizations that want a broad all-in-one analytics platform and can administer and forecast the proposed consumption model.
Starting From Scratch: A Practical SMB Playbook
Step 1: Name the decisions
Identify the three business decisions that currently depend on intuition, delayed exports, or disputed numbers. These become the first analytics use cases.
Step 2: Inventory the sources
For each use case, document:
- Source application
- Business owner
- Technical access method
- Update frequency
- Historical-data availability
- Known quality problems
- Sensitive fields
Step 3: Define the first metrics
Write the formula, filters, time logic, and source for each important KPI before building the dashboard. Assign a person who can approve changes to the definition.
Step 4: Choose the smallest appropriate architecture
- Choose a lightweight reporting stack when the sources and audience are limited.
- Choose a managed stack when the business lacks technical ownership or needs a more complete delivery experience.
- Choose a modular stack when a technical team wants component-level control and will own operations.
Step 5: Build one narrow production workflow
Do not begin by connecting every available source. Deliver one end-to-end workflow with real users, production permissions, documented metrics, monitoring, and an owner.
Step 6: Measure trust and adoption
Track whether the report is used, whether users agree with the numbers, whether it changes a decision, and how often the underlying pipeline fails. Expand only after the first workflow is dependable.
Migrating an Existing BI or Data Stack
Migration is not primarily a screenshot-recreation project. The visible dashboard is only the final layer. Calculations, data preparation, schedules, permissions, subscriptions, integrations, and user habits often contain more work than the layout itself.
1. Inventory and rationalize content
Collect usage data before recreating anything. Classify every important asset as:
- Retire: It is unused, obsolete, or duplicated.
- Consolidate: Several reports solve the same problem.
- Rebuild: It is actively used and belongs in the target platform.
- Preserve temporarily: It must remain available during transition.
- Replace with a workflow: The user needs an action or alert, not another dashboard.
Rebuilding everything exactly as it exists transfers old sprawl into a new platform.
2. Map data pipelines and refresh dependencies
Document every source, extract, transformation, refresh schedule, credential, gateway, local script, and failure notification. Decide which logic should remain in the BI layer and which should move into a shared data model or warehouse.
Both extracts and live queries are valid patterns. The correct choice depends on performance, freshness, source load, network availability, cost, and governance.
3. Build a metric dictionary
For each decision-critical KPI, document:
- Business definition
- Exact formula
- Source tables and fields
- Time-zone and date logic
- Filters and exclusions
- Currency or unit conversions
- Owner and approval status
This prevents a successful technical migration from becoming a business-trust failure.
4. Rebuild and test security explicitly
BI platforms implement identity, roles, row-level filters, object permissions, and embedding differently. Map the old model to the new one and test it using representative restricted users.
For customer-facing analytics, verify tenant isolation, exports, shared links, cached results, APIs, alerts, and AI-generated responses—not only the initial dashboard view.
5. Validate external delivery
If analytics is embedded in an application or portal, document:
- Authentication flow
- Tenant mapping
- Branding and navigation
- Mobile behavior
- Embed APIs and tokens
- Exports and subscriptions
- Accessibility
- Support ownership
- Writeback and workflow actions
Do not assume that two platforms use equivalent embedding or licensing models.
6. Use AI-assisted recreation carefully
AI-assisted building can help recreate layouts, queries, code, or visual components, but it does not eliminate validation. Calculations, lineage, permissions, interactions, accessibility, and performance still require human review.
Zuar's Build Agents and MCP-based tools are intended to accelerate content creation and migration work. During evaluation, request a proof of concept using representative dashboards rather than a simplified demo. Measure:
- Time to first accurate recreation
- Percentage of calculations reproduced correctly
- Filters and interactions preserved
- Security behavior reproduced
- Manual corrections required
- Performance against production-like data
Also confirm the availability status and supported source platforms for the capabilities included in the proposal.
 Joel Stellner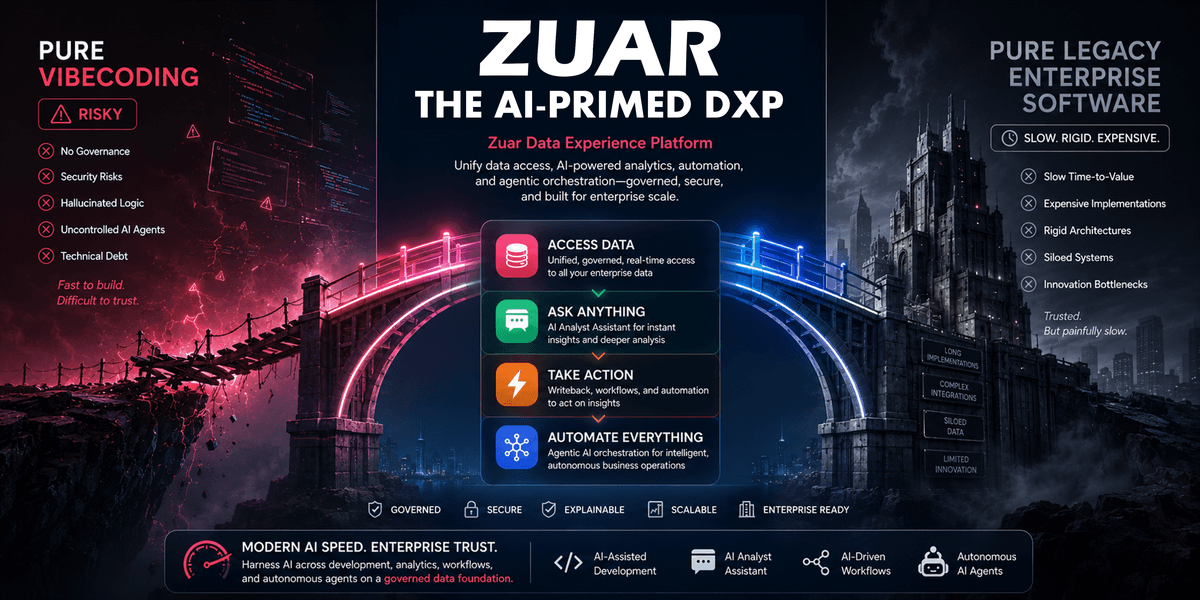
7. Run old and new systems in parallel
For high-value reports, run both systems through at least one complete reporting cycle. Reconcile the most important metrics and obtain approval from named business owners.
Define acceptance thresholds, cutover criteria, a rollback plan, and the date on which legacy licenses and infrastructure can be retired.
A 30-Minute Decision Framework
Are your needs simple and internal?
Start with Looker Studio, Power BI, Zoho Analytics, or another lightweight reporting option that connects to the required sources. Do not build a warehouse program solely because “modern data stack” articles say every company needs one.
Do you lack technical ownership?
Compare managed end-to-end platforms and implementation providers. Evaluate accountability for ingestion, modeling, analytics delivery, support, and future changes—not only the dashboard builder.
Do you have SQL or data-engineering capacity?
Consider a modular warehouse-centered architecture. Keep reusable business logic outside individual dashboards where practical, and assign explicit ownership for monitoring and cost management.
Do you serve external customers or partners?
Evaluate a complete embedded or portal scenario. Include authentication, row-level security, tenant isolation, branding, exports, workflow actions, and expected external usage in every quote.
Are you migrating because costs are unpredictable?
Do not compare list prices alone. Model users, capacity, refreshes, compute, ingestion, environments, implementation, and internal labor under the same workload.
Are you migrating because users do not trust the numbers?
Fix metric ownership, data lineage, and semantic consistency before changing the visualization layer. A new dashboard tool cannot resolve an undefined business metric.
Frequently Asked Questions
Does every small business need a cloud data warehouse?
No. A business with a few sources and straightforward internal reporting may be well served by direct connectors, a managed database, or a lightweight reporting stack. A warehouse becomes more valuable as sources, history, transformations, users, and governance requirements increase.
How much does a modern data stack for a small business cost?
There is no reliable universal figure. Costs may include platform licenses, user licenses, ingestion usage, warehouse storage and compute, implementation, support, and internal labor. Price the same workload with every vendor and calculate a 12- to 36-month total cost of ownership.
How long does implementation take?
A narrow first use case can sometimes launch in weeks, while a complex migration can take substantially longer. Source access, data quality, metric agreement, security, content volume, and user acceptance usually affect timing more than chart construction.
What makes a data stack AI-ready?
First, AI readiness starts with governed data, documented metrics and metadata, reliable pipelines, data quality, and access controls. The analytics platform should pass approved user permissions into AI experiences and provide trusted business context. Adding a chatbot to poorly governed data does not make the stack AI-ready. Then, having open-standards under the hood, modern API surfaces, and robust MCP and Harness tools are key to optimal AI workflows and integrations.
Can dashboards move automatically between BI tools?
Usually not in full. Tools may accelerate discovery, extraction, code translation, or recreation, but calculations, data models, security, interactions, and layouts rarely transfer perfectly. Test representative content and quantify the remaining manual work before committing to a migration plan.
What is the difference between a BI tool and a Data Experience Platform?
A BI tool primarily supports analysis, dashboards, and reporting. Zuar uses Data Experience Platform to describe a broader combination of data integration, governed analytics delivery, branded portals, embedded BI, AI-assisted experiences, and workflows. Because “DXP” is also used elsewhere to mean “digital experience platform,” buyers should evaluate the actual capabilities rather than the category label alone.
The Bottom Line
The best modern data stack for a small business is not necessarily the stack with the most products. It is the architecture the business can operate, afford, trust, and extend.
A lightweight reporting stack can be the right answer for a simple internal use case. A modular warehouse-centered stack can provide control to a company with technical ownership. A managed end-to-end platform can reduce integration and staffing burdens when the business needs multiple sources, governed delivery, external analytics, or hands-on implementation.
Zuar merits consideration when a small business wants data integration, a highly customizable analytics or portal layer, and implementation support from one provider. It is also relevant when an organization wants to preserve existing BI investments during a phased migration rather than perform an immediate rip-and-replace.
Whether you are migrating or starting fresh, get the convo started with our team:


Methodology: Products were evaluated by their role in the stack, technical ownership requirements, governance, internal and external delivery options, pricing model, implementation options, and migration implications. Vendor documentation was preferred for capability and pricing claims. This article was reviewed August 17, 2026.
