What data lineage tracking solves in ETL pipelines
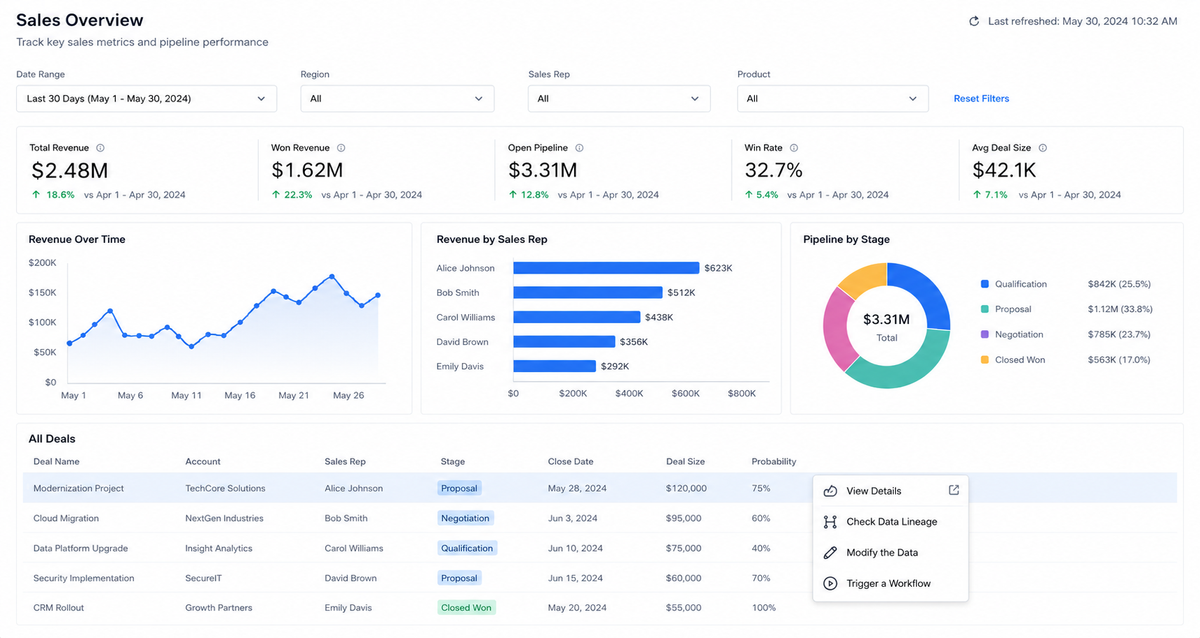
Data lineage tracking is the practice of recording where every field came from, which jobs touched it, and what changed along the way — source-to-target mapping plus the metadata that explains each transformation. In an ETL pipeline, that means knowing that a revenue column in a customer-facing dashboard traces back through a dbt model, a staging table, and a Salesforce extract that ran at 02:15 and failed its second task.
That record is what turns four recurring problems into solvable ones: auditing who changed a number and when, debugging a bad figure without reading every transform by hand, running impact analysis before you alter a schema, and giving the people reading your reports a reason to trust them.
Theory is easy; capture is hard. Lineage has to survive retries, partial backfills, and multi-step jobs that fan out across dozens of tasks. The OpenLineage specification models this with three core entities — dataset, job, and run — and requires a START event plus a terminal COMPLETE, FAIL, or ABORT event, so a run that died halfway still leaves a traceable record.
The rest of this guide covers what to emit at each pipeline stage, how to wire capture into orchestration, how to evaluate data orchestration software on lineage depth, governance, and cost transparency, and what to check when records go missing.
What lineage signals to capture at each pipeline stage
Useful lineage is a set of records written at three points — extraction, transformation, and load — all tied to the same run identifier so a single execution can be reconstructed end to end.
At the source, capture the system name, the object name (table, endpoint, or file path), schema version or a column fingerprint, the extraction timestamp and watermark, and the run or batch ID issued by your data orchestration software. Without that ID, source records float free of the job that produced them.
During transforms, record the job name, a code or package version (a Git SHA, a dbt project version), input datasets, output datasets, start and end timestamps, input and output row counts where the engine exposes them, and failure or retry status. Airflow, Dagster, and Prefect each expose task and run context your capture hook can read at execution time rather than reverse-engineer later.
At the output, record the destination table or file, partition or snapshot identifier, write mode (append, overwrite, merge), and the downstream assets — dashboards, reports, models — that read the result.
The minimum for a usable audit trail is run ID, inputs, outputs, timestamps, and status. Impact analysis and governance need more: column-level mappings, code versions, row counts, and ownership or classification tags.
How to implement lineage capture across sources, transforms, and outputs
Lineage becomes an operating pattern when every hop in the pipeline emits a record of what it read, what it wrote, and whether it finished. Six steps get you there.
1. Inventory the pipeline graph. List every source system, transformation step, and destination, plus the owner or service account responsible for each hop. Gaps in this list become gaps in your lineage later.
2. Fix one metadata model. Adopt consistent entities — dataset, job, and run are the core objects in the OpenLineage specification — so records from ingestion, dbt models, Spark jobs, and your warehouse can be joined instead of compared by hand.
3. Instrument the state transitions. Emit an event when a job starts and again on success, failure, or abort. The OpenLineage spec requires at least START and a terminal COMPLETE, FAIL, or ABORT event; that pairing is what lets you tell "never ran" apart from "ran and produced nothing."
4. Normalize identifiers. Give each logical execution one stable run ID and use fully qualified dataset names, so retries, backfills, and reruns collapse into a single lineage record rather than three partial ones.
5. Land events in a metadata repository. Lineage is metadata collected at each step and stored where it can be queried — a catalog, a lineage table in the warehouse, or whatever your data orchestration software already exposes. Airflow, Dagster, and Prefect all document native or integration-based lineage surfaces; check your version's docs before building custom emitters, and apply the same event contract to ELT jobs run through Zuar Runner.
6. Pilot on one pipeline. Trace a single source-to-dashboard path end to end, confirm failures and backfills appear correctly, then expand.
How to evaluate orchestration vendors for lineage, security, and observability
Evaluate data orchestration software on one question first: can the platform show you, for a specific broken output, the exact upstream run that produced it? Everything else is secondary.
Lineage model. Ask whether lineage is derived from execution history or maintained as documentation. Event-based models capture reality: the OpenLineage specification builds on three entities — dataset, job, and run — and requires at least a START event plus a terminal COMPLETE, FAIL, or ABORT event, so the graph reflects what actually ran. Qlik's lineage overview describes the alternative pattern: metadata collected at each step and stored in a central repository for analysis. Both are legitimate; a hand-maintained diagram is not.
Security and governance. Confirm row-level security on the datasets lineage exposes, per-team or per-tenant separation of metadata, audit logs on who viewed which lineage graph, and whether access boundaries follow a run's downstream outputs. Lineage metadata leaks schema, table names, and client identities — treat it as sensitive.
Observability depth. Dagster organizes its product around assets, runs, lineage, freshness, failures, and automation history; Prefect emphasizes durable execution, asset-based orchestration, checks, and freshness. Both are stronger than most on native asset modeling. Airflow's advantage is operational familiarity and ecosystem reach — OpenLineage ships integrations for Airflow, Spark, dbt, Flink, Hive, Trino, Great Expectations, Feast, and SQL. Read the official docs before the sales deck.
Commercial criteria. Test metadata exportability directly: emit events, then try to pull the full history out. If you cannot, you have lock-in. Check cost attribution per run and per dataset for FinOps review, plus published SLA terms.
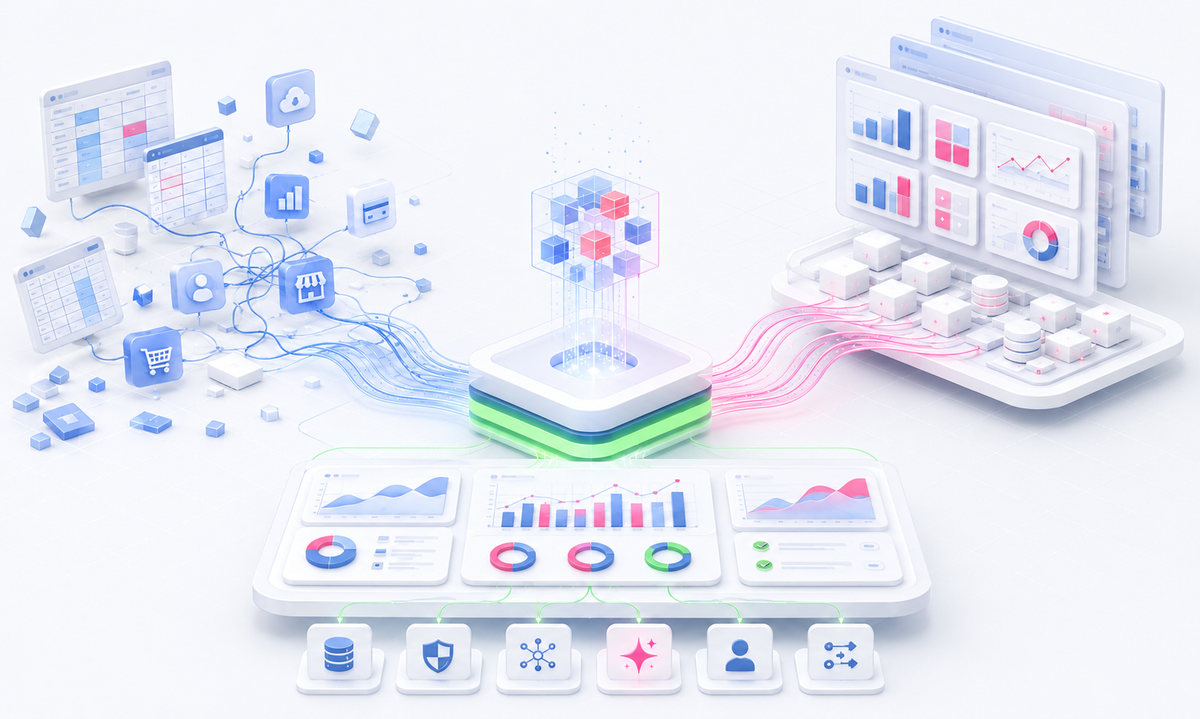
Zuar's answer sits inside the stack rather than beside it: Runner's internal models and General MCP expose job run history — status, retries, timestamps — and its Catalog/Semantic MCP exposes which business metrics, definitions and columns a model created or consumed, while Portal's MCP exposes which downstream reports depend on the result. Content packs for data lineage and job run health monitoring surface that view out of the box, and because it's wired through MCPs, the same metadata that drives a dashboard can be queried directly by an AI agent asking "what fed this number" — not just read off a static graph.
Troubleshooting missing, partial, or inconsistent lineage records
When lineage goes missing, isolate the stage where the record died before you touch pipeline code. There are four candidates: emission (the job never produced an event), transport (the event was produced but never delivered), normalization (it arrived but failed validation against the spec), and storage (it validated but never landed in the metadata repository). Each points to a different fix, and only one of them requires changing the pipeline.
Emission failures are the most common: a task that bypasses the orchestrator's hook, a retry that fails before the completion event, or a job that emits a START event with no matching COMPLETE, FAIL, or ABORT — the minimum event pair the OpenLineage specification expects. Partial records usually mean schema drift or a transform emitting job metadata without column-level detail. Backfills are their own hazard; if they reuse or overwrite run identifiers, the history collapses into a single ambiguous node.
Inconsistent records are a naming problem. Reconcile by mapping each system's dataset identifier to one canonical namespace, then keying on run ID rather than table name.
Test the repair by replaying one known path end to end and confirming the repository shows the complete source-to-output chain, not just the endpoints. Then document which lineage fields are mandatory. Writing that contract down is what keeps future changes from quietly degrading visibility.
Key takeaways for choosing data orchestration software with usable lineage
Lineage is only useful when source, transform, and output metadata attach to real execution history — which run produced this table, from which upstream version, with which failure. A graph drawn from static SQL parsing tells you what should happen. A graph fed by run events tells you what did.
Use that as the buying standard. When you evaluate data orchestration software, ask vendors to demonstrate five things on your own pipelines, not a demo dataset:
- Metadata completeness — column-level or table-level? Does a failed run still emit a record?
- Observability — are run state, freshness, and retry history queryable, or only visible in a UI?
- Security and governance — who can see lineage for which tenant, and is that access logged?
- Exportability — can you pull the lineage store out via API into your own catalog, which is your main defense against lock-in?
- Documentation that matches your stack — Airflow, dbt, Spark, Snowflake, whatever you actually run.
OpenLineage gives you the technical model — datasets, jobs, runs, and the START/COMPLETE event contract — and that model is genuinely stronger as a portable standard than most single vendor's internal graph. What it doesn't hand you is an operator-friendly rollout pattern or governance boundaries; those you still design. Dagster and Prefect both ship strong asset-level execution context, so credit them there and confirm current capabilities directly with each vendor.
Zuar's packaged data lineage and job run health put that exact history — job runs, columns created and used, upstream dependencies, downstream reporting impact — in front of both the people reading a dashboard and the AI agents querying through Runner's General and Catalog/Semantic MCPs and Portal's MCP, and all of this included content can be extended and customized for any use case in the platform.
 Whitney Myers
 Joel Stellner
 Joel Stellner