July 2026 / Data Experience Platform
Key Takeaways
- The Blank Canvas block type unlocks genuinely unlimited possibilities. Portal's HTML/CSS/JavaScript canvas gives you the full power of the browser — Canvas API, physics engines, particle systems — without sacrificing a single row of RLS or a single SSO rule.
- AI toolkits collapsed weeks of build time into minutes. Portal 1.19's built-in Builder Assistant Agent (Pre-release), Claude MCP and Skill packs (currently being curated by Zuar Labs) mean that "I have a creative idea for a dashboard" no longer requires a frontend engineering team to engage.
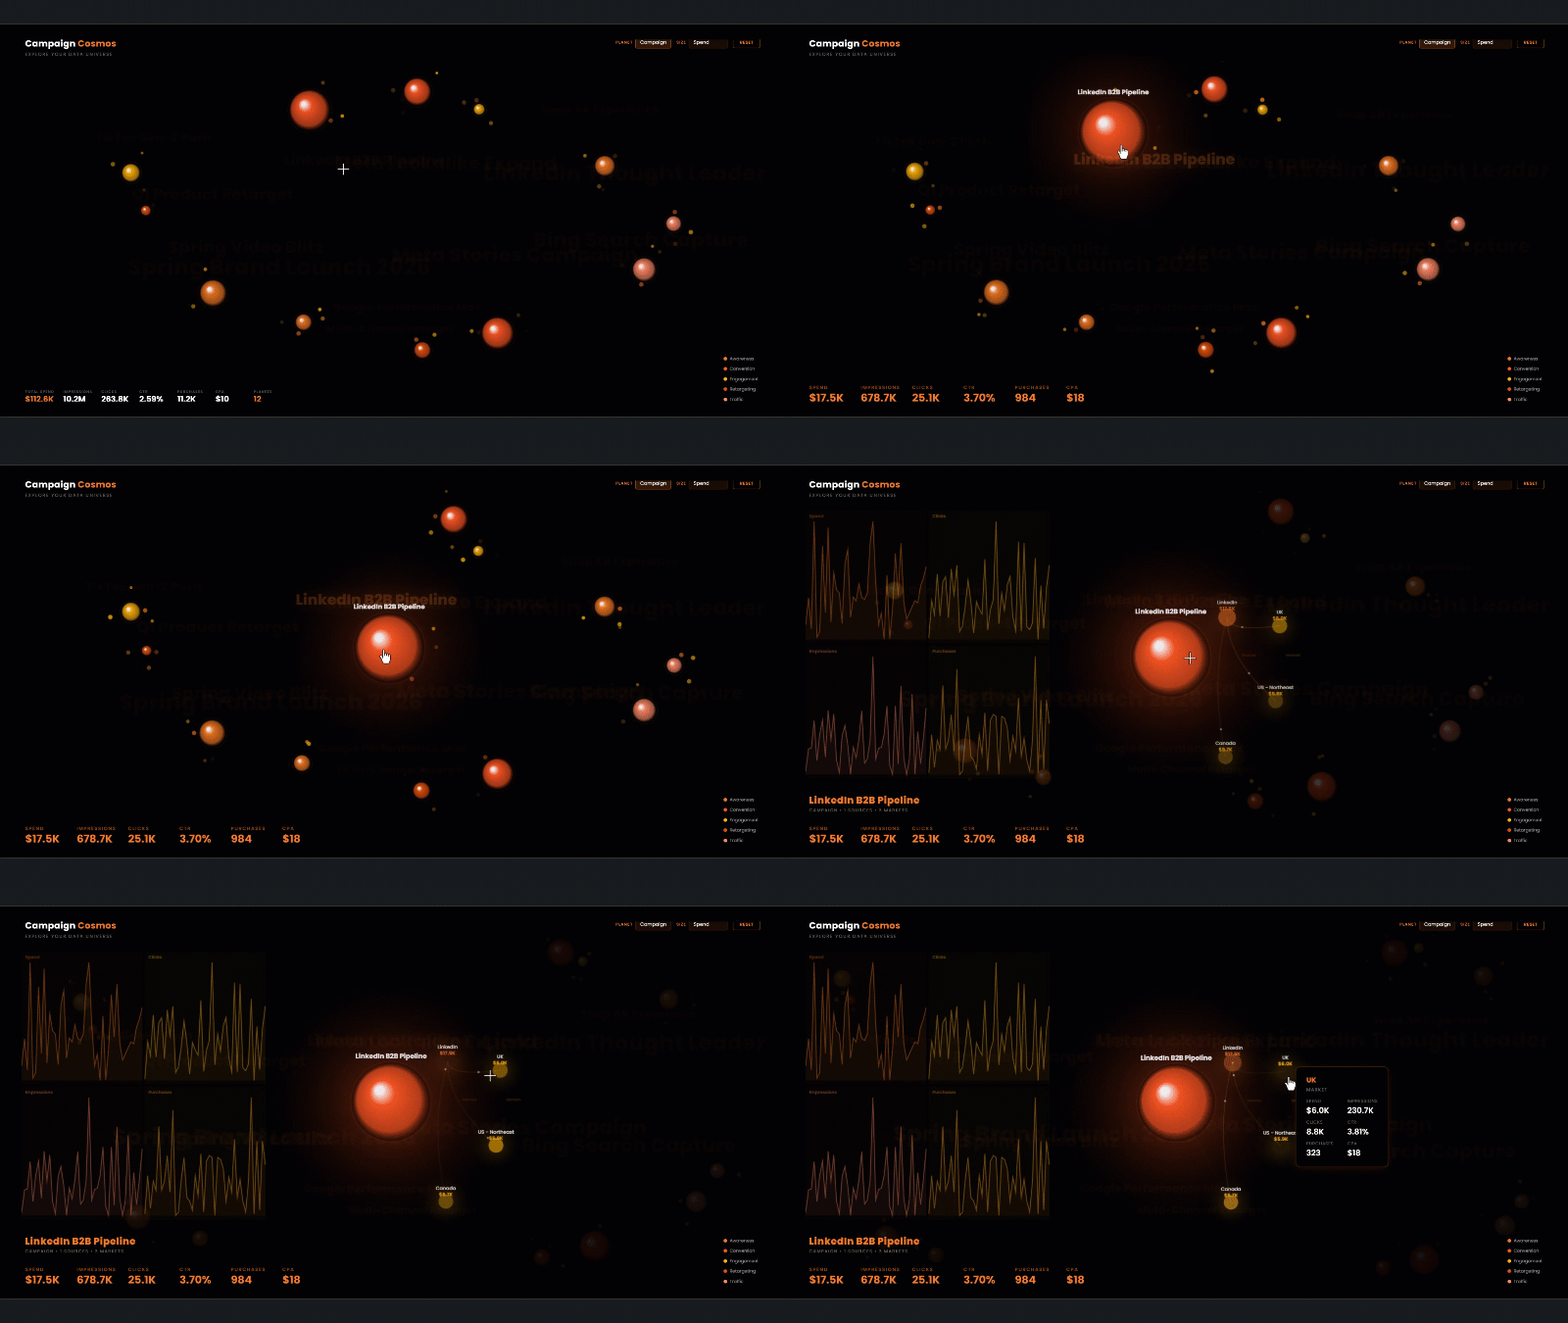
- "Vibecoded" does not mean ungoverned. Campaign Cosmos is a fully animated, physics-driven cosmic visualization running inside Zuar Portal's security framework — complete with real SQL queries, Row-Level Security, and user-aware data. The creativity is real. So is the governance.
- Content Packs make it reusable for everyone. Campaign Cosmos will be published as a downloadable Content Pack, so you can swap in your own data source and have this running in production in minutes — no rebuilding from scratch.
- This is what a true Data Experience Platform looks like. The same platform that powers internal analyst dashboards, embedded customer portals, and now an orbital marketing command center is Zuar Portal. One governed stack. Endless surface area.
The Rules of Data Visualization Are on the Table
For years, the unspoken contract in business intelligence was this: data looks like data. Charts have axes. Tables have rows. Dashboards are grids. And within those constraints, the industry spent two decades iterating on color palettes and font sizes.
The truth is that many of these 'best practices' and 'rules' were heavily influenced by the limitations of the previous generation of BI Platforms.
We still believe in tried-and-true best practices for production dashboards — clarity over cleverness, context over decoration, and actionability above all. Those principles are not going anywhere. But the rules about what a dashboard is allowed to look and feel like? Those are very much on the table for review.
The reason is simple: AI has fundamentally changed who can build what, and how fast. When a data-savvy analyst can go from concept to deployed, governed, production-grade dashboard in a matter of minutes — not weeks — the calculus around creative risk changes entirely. Experimenting with an unconventional visualization format no longer means pulling an engineer off a sprint. It means an afternoon.
Campaign Cosmos is our proof of concept for this new reality. The point of the build is not to suggest that 'this is what production client facing marketing dashboards should look like now' - it is to demonstrate the advanced and creative visualization capabilities within the Zuar Data Experience Platform, coupled with the most modern AI based coding workflows enabled by the Zuar framework.
The Technical Reality Behind the Experience
Here is the detail that separates Campaign Cosmos from a beautiful mock-up: it is running inside Zuar Portal's standard Block framework. That means everything that makes Portal a serious enterprise BI platform — Row-Level Security, SSO, user-aware data, connection-level credential obfuscation, dashboard-to-dashboard filter events — is fully operative.
The dashboard pulls from three coordinated SQL queries:
- Q0 (aggregate): Pre-aggregated campaign performance metrics that hydrate instantly, powering the planet objects, KPI bar, and legend.
- Q1: Reserved for dimensional metadata.
- Q2 (raw/detail): A row-level dataset that loads behind the scenes and powers the sparkline charts on drill-down — with a smart retry loop built into the initialization code to ensure sparklines render correctly even on cold page loads, before Q2 finishes hydrating.
That last point is worth noting: the engineering care in the code reflects real production thinking. The dashboard does not fail silently if Q2 is slow. It waits, retries up to 60 times over 15 seconds, and falls back gracefully to an empty state rather than rendering broken charts.
The canvas itself is built on the browser's native HTML5 Canvas - no charting library required. Every planet, moon, orbit ring, glow gradient, connection line, and energy particle is drawn frame-by-frame using requestAnimationFrame, with a full physics engine underneath: damping, drift velocity, collision avoidance between planets, spring-force homing, and cursor-attraction on hover. Planet radii are computed dynamically from the chosen metric range, with smooth interpolation so size changes animate fluidly when you switch from Spend to Impressions.
The Portal integration goes further than aesthetics. The dashboard listens for Portal's nativeEventBridge filter events — meaning if a user applies a filter from another block on the same Portal page, Campaign Cosmos responds automatically, updating planets, moons, and KPIs to reflect the new context. It can also be instantly re-themed and automatically color matched to each client. It is a first-class citizen in the Portal dashboard ecosystem, not an iframe island.
Column mapping is also self-healing. Rather than assuming a fixed column order in the SQL result, the initialization code dynamically reads column metadata from currentBlock.queryResults and maps column names to indices at runtime. This means the visualization works correctly regardless of how your DBA orders the SELECT clause — a small detail that makes the difference between a demo and a production deployment.
 Joel Stellner
How This Was Built: Portal 1.19's AI Toolkits
Campaign Cosmos was built in Zuar Portal 1.19 using three AI-powered capabilities that represent a meaningful step change in how fast governed BI content can be created:
1. The Built-in Builder Assistant Agent (pre-release)
Portal's inline AI agent works directly inside the block editor. Describe what you want — "a cosmic visualization where campaigns are planets sized by spend, with drill-down to sparklines" — and the agent generates, iterates, and debugs the HTML/CSS/JavaScript in context, with access to the live query results and the block's security environment. No context-switching to an external code editor. No manual copy-paste of data schemas.
2. Claude MCP + Zuar AI Skillpack (Via Zuar Labs)
For more complex agentic workflows, Portal 1.19 exposes MCP (Model Context Protocol) tools that let you direct Claude or another capable LLM to build inside Portal directly. The Zuar AI Skillpack gives the agent structured knowledge of Portal's block types, query patterns, CSS conventions, and event bridge API — so it is not just writing generic JavaScript, it is writing JavaScript that understands how to talk to Portal's data layer and security context.
3. The Blank Canvas Block Type
This is the unlock that made all of the above possible. The Blank Canvas block in Portal accepts raw HTML, CSS, and JavaScript, and executes it within Portal's security sandbox. That means you get access to currentBlock.queryResults (your live SQL data), Portal's filter event system, and the full rendering surface of a modern browser — all while Row-Level Security, credential obfuscation, and user-awareness continue to operate at the platform level, below the canvas. You cannot break governance by writing creative code here. The platform holds that line for you.
Why This Matters for Your BI Strategy
There is a version of this story that is just "look at this cool dashboard." That is not the version we want to tell.
The version we want to tell is about what this demonstrates architecturally — because it has direct implications for how you should be thinking about your entire BI stack.
One platform for everything. The same Portal instance that serves your internal analyst dashboards, your embedded customer-facing analytics portal, and now an orbital campaign visualization running on a trade show touchscreen is the same stack. Same SSO. Same RLS configuration. Same connection credentials. Same deployment model. That is not a coincidence — it is a deliberate design choice that compounds in value as your analytics surface area grows.
Governance does not have to be a ceiling. One of the most common complaints about enterprise BI platforms is that governance becomes a constraint on creativity. The platform that keeps your data safe is also the platform that prevents you from building anything interesting. Campaign Cosmos demonstrates that this tradeoff is not inherent. When governance is handled at the infrastructure layer — RLS at the connection, credential obfuscation at the runner, SSO at the portal — the application layer is free to be as creative as it needs to be. The Blank Canvas block is not less governed than a standard chart block. It is equally governed, with more room to move.
AI amplifies open architecture, not closed templates. This is the deeper lesson from how Campaign Cosmos was built. An AI coding assistant is only as capable as the platform it is building on. In a traditional BI tool with a proprietary visualization engine, even the best LLM hits a ceiling — it can only configure what the tool exposes through its UI or limited API surface. On a platform where the block is a blank HTML/JS canvas, the AI's full generative range is available. Every D3.js technique, every Canvas API capability, every animation pattern the model has learned is applicable. Zuar DXP's open canvas block architecture does not just help human developers — it makes AI-assisted development genuinely powerful.
The "mock vs. real" distinction matters more than it seems. Anyone can vibecode a beautiful marketing visualization in a standalone HTML file. What you cannot do in a standalone HTML file is connect it to a real customer's data, enforce row-level security so they only see their own records, deploy it in minutes via a governed content management system, and let a client log in securely and explore their own data universe. The gap between "a beautiful mock" and "a production-ready client deliverable" used to be weeks of engineering. In Portal 1.19, it is a connection string swap.
Campaign Cosmos as a Content Pack
Campaign Cosmos will be published as a Content Pack in Zuar Portal. That means when it is available, you will be able to download it, point it at your own marketing data source, and have this visualization live for your users — whether that is your internal marketing team, your agency clients, or a trade show audience — in minutes. No reverse-engineering the physics engine. No recreating the SQL query structure. No rebuilding the Portal event bridge integration.
This is the first of a broader content pack rollout Zuar is executing across a wide variety of use cases, industries, and source systems. The intention is to dramatically compress the time between "we have this data" and "we have a production-quality experience for that data."
If you are a marketing analytics practitioner, the use case here is immediate: campaign performance data from Google Ads, Meta, LinkedIn, TikTok, or any SQL-accessible source becomes an explorable data universe that your clients or executives can navigate directly — without a spreadsheet in sight.
 Whitney Myers
The Bigger Picture: What to Look for in a BI Platform in 2026
The BI market is bifurcating. On one side, tools that are optimized for standardized chart types, quick time-to-first-dashboard, and low technical barriers. On the other, platforms that treat analytics as a development surface — one where the security, data access, and deployment infrastructure are handled at the platform level, and the application layer is genuinely open.
Traditional BI tools are very good at what they were designed for. But they were not designed for anything like Campaign Cosmos. They were not designed for the kind of creative, code-first, AI-accelerated analytics development that is becoming table stakes for companies that want to build differentiated data experiences — for themselves, and for their customers.
Zuar DXP was designed for exactly this. A platform where:
- The data layer is governed — SQL connections with RLS, credential obfuscation, user-aware context propagated to every block on the page.
- The development layer is open — Blank Canvas blocks, full HTML/CSS/JavaScript, access to any library that runs in a browser, and AI toolkits that make non-engineers capable of building production-grade applications.
- The deployment layer is unified — one Portal instance for internal dashboards, embedded customer portals, and creative immersive experiences, all under the same SSO and permission model.
Campaign Cosmos is one demonstration of what that stack makes possible. The runner job health explorer we wrote about earlier this year is another. The dashboards your team has not built yet are the ones we are most interested in.
Ready to Explore Your Data Universe?
Portal 1.19 is available now. The Campaign Cosmos Content Pack is coming. The AI toolkits — Builder Assistant Agent, Claude MCP, and the Zuar Skillpack — are here.
The future of data visualization is not just better charts. It is better experiences. And experiences this good can now be built in minutes, not months — as long as you are building on the right foundation.
If you want to see what a properly governed, genuinely creative data experience platform looks like for your organization's data, contact us:


FAQ
Q: Is Campaign Cosmos actually connected to live data, or is it a demonstration mock-up?
A: It is a real dashboard running in Zuar Portal, connected to a live SQL datasource with Row-Level Security and user-awareness active. The visualization layer is creative; the data layer is production-grade.
Q: Do I need coding skills to build something like this in Portal?
A: Not necessarily. Portal 1.19's built-in Builder Assistant Agent and Claude MCP integration allow data-savvy analysts without frontend engineering backgrounds to generate, iterate, and deploy Blank Canvas blocks using natural language. The AI handles the HTML, CSS, and JavaScript. You provide the vision and the data.
Q: How does Row-Level Security work in a Blank Canvas block?
A: RLS operates at the connection and query level, below the canvas. When Portal executes your SQL queries and surfaces results in currentBlock.queryResults, those results already reflect the RLS filters applied to the authenticated user. The JavaScript in your Blank Canvas block never sees rows the user is not permitted to see — and there is no way to write code that bypasses this, because the filtering happens before the data reaches the client.
Q: What source systems does Campaign Cosmos support?
A: Any SQL-accessible data source that Zuar Runner can connect to — which includes Google Ads, Meta, LinkedIn, TikTok, Bing, and any other marketing platform data that has been landed in a data warehouse (Snowflake, BigQuery, Redshift, PostgreSQL, and others). The visualization expects a standard set of columns (campaign, source, market, spend, impressions, clicks, purchases, sessions) and maps them dynamically at runtime.
Q: When will the Campaign Cosmos Content Pack be available?
A: It will be published in the Zuar Portal Content Pack library shortly. Follow Zuar on LinkedIn or check the Portal release notes for the announcement.
